How to Render an SSRS Report Asynchronously using the Async\Await Keywords in C# 5.0 with .NET 4.5

The .NET Framework 4.5 introduced a simplified approach to the task-based asynchronous programming model (which was introduced as part of the Task Parallel Library API in .NET 4.0) via the utilization of the two new keywords:  “async” and “await” in C# (Async and Await in VB.NET). For detailed information, see Asynchronous Programming with Async and Await (C# and Visual Basic)  on MSDN.

In this post, I’d like to show you how we could use these new keywords when making asynchronous calls to the SQL Server Reporting Services web service.  For the purpose of simplicity, I created a very simple Windows Forms project in Visual Studio 2012 in which I just have one button which invokes the SSRS web service in the click event handler.

First we need to make sure the target framework for the project is set to .NET 4.5 in Visual Studio 2012 (from the project properties).

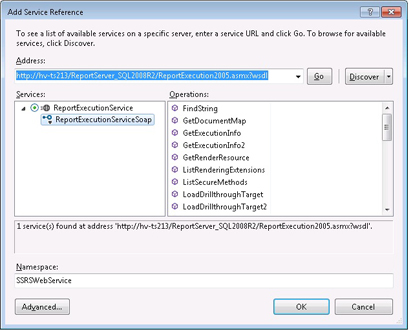
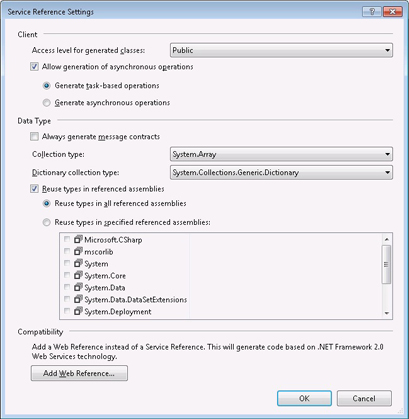
Then we add a service reference to the SSRS web service. This part is a little tricky.  In the “Add Service Reference” dialog, after we put in the URL of the ReportExecution2005.asmx file of the Reporting Services into the Address box and locate the service, in the “Services” panel it should list the “ReportExecutionService” and if you expand that, it would show the “ReportExecutionServiceSoap” underneath. Here we select the Soap service. Then, after specifying a namespace for our reference (I just named it as “SSRSWebService”), we click on the “Advanced” button at the bottom which opens the “Service Reference Settings” dialog (as seen in the screenshots). In this latter dialog, we will make sure the “Allow generation of asynchronous operations” is checked and the “Generate task-based operations” option is selected. What this does is that Visual Studio will generate the async methods for the SOAP proxy class by using the Task<> return types.  Then we click “OK” and close the dialog.

HowtorenderSSRSreport_image1 HowtorenderSSRSreport_image2

Here I would like to underline one key part. In the second step we added the reference to the SSRS web service as a “service reference” (just like a WCF service), not as the legacy web reference (which was the old way of adding web service references prior to .NET 3.5 and WCF).  One other thing I want to point out is that here I am using the ReportExecutionServiceSoapClient proxy class, not the ReportExecutionService class which would have been the case had I added the ASMX reference as a legacy web reference. The interfaces exposed by SSRS differ slightly (different method signatures and different members) between when it is added as a WCF service (in this case it is the SoapClient) versus a legacy web reference.  Since my goal is to use the new .NET 4.5 features, I had to create the service reference in the new WCF way.

In my WinForms project I render the report located at the /MyReports/Report1 directory in SSRS as a PDF file. Here is the code for the button’s click event handler: Continue reading How to Render an SSRS Report Asynchronously using the Async\Await Keywords in C# 5.0 with .NET 4.5
Windows 8.1 Hyper-V in Review

Credit: TechRadar.com

[Reposted from www.nicolascouraud.com]

Working with developers, I have a love of client-side virtual environments. They allow for snapshots, easy portability of the development environment, and simple and unobtrusive replacement if and when someone blows up their development workstation. When Microsoft announced they were adding client-side Hyper-V in Windows 8, I had high hopes. However, the Windows 8 RTM release of client-side Hyper-V left a lot to be desired from a client-facing solution. It was merely a port of the server-side experience to the client. While it works well for me (I tend to run everything over RDP anyways), for our developers, lack of basic functionality like copy-paste or dynamic window sizing made it DOA.

Thankfully, in the Windows 8.1 (Blue) release, many of these shortcomings have been rectified! The virtual machine connection windows have been redone using the remote desktop engine which means that all of the features you didn’t have before (sound, 3D graphics acceleration, copy-paste), are now available without any workarounds. The full list of features supported in this enhanced session mode are: Continue reading Windows 8.1 Hyper-V in Review

Baseball’s All-Star Break: Predicting the Game Using Excel

Major League Baseball
Credit: Ampsportsduo.blogspot.com

In keeping with my sports theme from March, on March Madness and predicting the NCAA tournament, it is time to look at this season’s sport: Baseball. As you might know, Major League Baseball’s All-Star game is tonight, so let’s use Excel to pick which league (the AL or NL) will be victorious, so we can kick back and enjoy the game.

Baseball has long been associated with using stats to predict outcomes and player performances. This was made famous in the movie Moneyball, and has its own cottage industry around helping fantasy baseball players perform better. There is no shortage of information that can be gathered about baseball, with the whole industry even having deemed the term: sabermetrics.

Before jumping into the vastness of data, however, I want to point out where we are getting the data from. There are many different sources for baseball stats, many requiring a fee, but I will be referring to the Sean Lahman Baseball Stats Database. It is open source, so you can just download a version that works for you, and run with it. I am only going to look at the players who have actually appeared in the All-Star game and their year’s performance.

The other source of data is the year-to-date stats for the All-Star players. These can be gathered from the many, many sports sites (like ESPN.com), but is a manual process. I will leave it as an exercise for the reader to copy and paste those! You can find the sum of those in the example file attached.

Just to simplify things, we are going to use the old standbys: Earned Run Averages (ERA) and Batting Averages (BA) to compare the two Major League Baseball leagues. The other consideration is to analyze data from just the “Long Ball Era,” which started in 1994. Since the sport has been around so very long, it helps to categorize the data so you get a better apples-to-apples comparison.

The first step is to get the data into your database. I used the Access file download, since SQL Server 2008 R2 can import that directly, and you don’t have to do any of the conversions. The data is also available in CSV and MySQL format. Now that we have a nice almost relational database, all we need are a couple of SQL statements to get the data for our processing needs. (They have been attached for reference.)

On to building our Excel workbook. Continue reading Baseball’s All-Star Break: Predicting the Game Using Excel

How to create stock charts using ExcelApplication

Problem

You need to create stock charts like the High-Low-Close or candlestick charts that Excel provides, but ExcelApplication does not have an enumeration for these charts.

Solution

Introduction to Stock Charts

Excel can create four kinds of charts intended for analyzing stock data. These are often referred to as high-low-close or candlestick charts because of their distinctive shape. These charts can be easily created with the Chart Wizard in Excel.

It is possible to use these charts with ExcelTemplate as you would any other chart. While ExcelApplication contains enumerations for many kinds of charts it does not have one for stock charts. Because of this, they cannot be created directly. In this article I’ll explain how to use a line chart and some special formatting to create charts that look exactly like each type of stock chart provided by Excel.

Setting up the data

Stock charts require very specific data in a very specific order. If you look at the names of the charts in Excel, you’ll note that each of them is actually a list of the data that chart needs, in the order that chart needs it. The four kinds of charts are High-Low-Close, High-Low-Open-Close, Volume-High-Low-Close and Volume-High-Low-Open-Close. As you can see, there is significant overlap and the data always appears in the same order; only the presence or absence of Volume and Open Data is different. For all of the following examples, we’ll use the same data pictured below:

For simplicity, we’ll create areas for each section of data and name them volumeAreaopenAreahighArealowArea and closeArea. Now that we have that, we can start creating stock charts.

A Basic High-Low-Close Chart

The simplest chart to create is a High-Low-Close chart. This chart displays the high and low values for a stock as a vertical line, with a tick mark at the point where the stock closed for the day. To begin creating this chart, we’ll follow a formula that will remain the same for all of the other stock charts.

First, create Continue reading How to create stock charts using ExcelApplication

The Intern Diaries: Shane – I’ve Made a Huge Mistake

When I chose Riparian Data, I had no idea what I was getting into. I showed up to my first day excited to organize filing cabinets and get print outs. I can get a mean cup of coffee or drop something off at the post office in under 2 minutes. Much to my dismay, there were no filing cabinets, and developers got their own coffee. I didn’t even realize we had a printer for the first four weeks. Instead the team expected me to write code. Not just any code, though, they wanted me to write actual code for the app. I realized they were a little confused and tried to explain to them that I was an intern. They just didn’t get it and kept trying to give me real work, as if they actually expected me to provide productive contributions.

After talking to a few friends, I realized how unlucky I was. One has to play with the company’s app all day everyday without ever seeing the code. Another does have to work on code, but, not to worry, it will never actually touch his company’s product (phew!). I need to acknowledge, though, that it could be so much worse. One friend has been tasked with creating an entire web application for his company. Not only must he code, but he must design and plan an application for actual use. Dreadful, I know.

Really, though, internships are pretty sweet. I get 2 months to check out a company and work with their full time devs on a real product. I’m expected to jump right in and learn as I go. I came in with zero iOS experience and was supposed to spend my first few days simply learning Objective C and Xcode (the IDE for Apple Apps). Over the past month, I’ve worked on everything from finding the best way of connecting the server to our database to localizing our app so it could potentially be translated into other languages.

For college kids like me, internships are like the 90-Day Money Back Guarantees of the working world. We get the chance to jump into a company and see it from the inside. It is about more than just getting to do “real world” code. It also gives us a glimpse into how companies really function and what type of company matches our personality. Some of my friends loved the idea of working at a huge company with products that play a part of our everyday life, so they went to Facebook or Google. A few others were interested in the startup culture, so they found tiny startups to work for.

With my friends working all over the place, I’ve been asking them about their experiences and teams. For this post, I decided to send out a little survey to get a little bit of a bigger picture on my friend’s internships. I received about 60 responses, mostly from Olin students. Here are the questions along with the most common answer:

  • What type of internship is it? Computer Engineering/Software
  • Given the chance, would you return to this company? Yes
  • On a scale from 1-10, how much responsibility are you given compared to a full-time employee? 7.317
  • Was this internship your first choice? Yes
  • What class are you in? 2015
  • How large is the company? 15-50 People or 1000+ People

I found a few interesting stats when I started to punch the numbers.

Continue reading The Intern Diaries: Shane – I’ve Made a Huge Mistake

How to prevent line breaks after an empty merge field

Problem

When you use the WordTemplate object to populate a WordWriter template document with data retrieved from a data source, you may have situations in which a merge field is not bound to a value. The most common scenario is creating a mailing address. Each field of a mailing address may be represented by a merge field. Typically, the second line of the address is optional. In the generated document, if the merge field corresponding to the second line of the address does not have a value, a blank line may be present.

In Microsoft Word, a blank line generated during a mail merge can be suppressed using application settings. With WordWriter, a blank line is not automatically removed.

WordWriter template document:

Generated document:

Solution

The following discussion uses a merge field called AddressLine2 as an example, but is applicable to any field with optional value.

In the WordWriter template document, if the line break is separate from the AddressLine2 merge field, the line break will be present in the generated document whether or not Continue reading How to prevent line breaks after an empty merge field

How to create a drill-down report in Excel with hyperlinks

Problem

Reporting Services provides drill-down report behavior, where clicking on a populated data field generates another report based on the value of the data field clicked. This post addresses how to acheive similar behavior within Excel with OfficeWriter using Reporting Sevices URL access and Excel’s HYPERLINK function.

Solution

Overview

When the OfficeWriter renderer populates the Excel report with data, it inserts new rows for each row of data. This means that all Excel formulas are updated, including the HYPERLINK function formula. This approach uses this formula update functionality and imported data values to dynamically create hyperlinks that point to the Reporting Services URLs.

For the sake of example, “SalesReport” is the original report that contains a list of invoice IDs. “InvoiceReport” is the linked report that takes an InvoiceID as a parameter.

Reporting Services URL Access

Typically, Reporting Service reports are rendered through an application, such as the Report Manager. Reporting Services also allows for rendering reports using just URLs. The basic syntax to render a report wtith a parameter is:

 http://[servername]/reportserver?/[File path to report on Report Server] &rs:Command=Render&rs:Format=[Rendering Format]&[ParamID]=[Param Value] 

The URL for rendering the “InvoiceReport” in the OfficeWriter for Excel format, with Invoice ID 12345, is as follows:

 http://myservername/reportserver?/ InvoiceReport&rs:Command=Render&rs:Format=XLTemplate&InvoiceID=12345 

Notes:

The Intern Diaries: Alex

interns_alexThis is the first installment of our Intern Diaries series, wherein each week our lovely interns give you the inside scoop on what being a programming intern at a high-tech startup is really like. This week Alex walks you through first impressions of his internship.

Hello, my name is Alex, and I am a sophomore at Oberlin College. I have been interning at SoftArtisans for a little over a month and am happy to report that my expectations have already been exceeded. I do real work, get to code, and have learned about the different parts of a software company.

Before arriving at SoftArtisans I didn’t have any warm and fuzzy feelings associated with offices. My dad works at a big law firm in Boston and over the years, my visits have shaped my perception of the work world. His office is a sterile and quiet place. The walls are white and the floors are so clean that I almost feel funny walking in with my sneakers on. However, after entering and sensing the atmosphere, it is evident shoes are not to be removed.

This leads me to why I love being at SoftArtisans. Sure it’s great to walk around barefoot and wear casual clothing, but more than that, it is all the other reasons that I feel comfortable at work.

I am a technical support intern and every day the Technical Services (TS) department does something called Stand-Up. During Stand-Up the team circles up and takes turns saying what they are working on. In addition to keeping the team organized, Stand-Up is a great opportunity to voice any concerns or ask for help.

In one of my first Stand-Ups, Continue reading The Intern Diaries: Alex

Summer 2013 Interns

Our favorite time of year is upon us. It’s summertime, and that means kayaking down the Charles, BBQ’s in the parking lot, and best of all summer interns. We’re handing over the blogging reins to this talented crew. Each week follow along as they give you an inside look at SoftArtisans and Riparian Data, life as an intern at a start up, and any other random musings that pop into their heads. They’ve already taken over with their podcast. Listen in on itunes!

Summer 2013 Interns

(Top row: Kyle, Justin, Daniel, Front row: Madalyn, Alex, Shane)

The questions:
1. Where do you go to school?
2. What do you study?
3. Give us a unique/random fact of your choosing.

The answers:

Kyle:

1. Olin College of Engineering.
2. Software Engineering and Applied Mathematics.
3. A random fact about me is that I am the music director of Olin’s premier a cappella group, the PowerChords.

Justin:

1. Rochester Institute of Technology
2. Game Design
3. The average color of the universe is known as Cosmic Latte.  (If it was actually supposed to be about me, then… uh… on good days, I could see Canada from the house where I grew up?)

Daniel:

1. Gann Academy

Madalyn:

1. I go to Worcester Polytechnic Institute (WPI)
2. I study Computer Science and Digital Art.
3. The longest (documented) that a person has ever lived was to the age of 124 years.

Shane: 

1. Olin College of Engineering Continue reading Summer 2013 Interns

How to create a custom SQL Server Reporting Services error page

Problem

When SQL Server Reporting Services (SSRS) encounters an error, it returns an error message which is displayed by Report Manager. The error message can include technical details that reveal more information than necessary or are potentially confusing or intimidating to a user. One example is the scenario in which the user attempts to export a report from Report Manager using the “Excel designed by OfficeWriter” option, but the report is not created using the OfficeWriter Designer. In this case, SSRS would return the following error:

 Error SA008050: This report was not designed for the selected OfficeWriter rendering extension. 

Depending on configuration, Report Manager may also display a detailed error message and a stack trace. In this case, the error message is self-explanatory. However, often it is desirable to provide a friendly custom error page that hides the technical details of the internal exception and provides more helpful instructions to users.

Configuring a custom error page for Report Manager is no different from doing so for other ASP.NET applications. The custom error page is simply a web page that you create. You can configure ASP.NET to display a custom error page to all users. Alternatively, the custom error page can be displayed only to users accessing Report Manager from a remote machine, which is usually the case in production. For users accessing Report Manager from the same machine, the full error would be displayed. Typically, a detailed error message is helpful for debugging purpose during development.

Additionally, you can configure a custom error page to be displayed for specific HTTP status codes. For example, the OfficeWriter error above is an internal server error, which results in HTTP status code 500.

Solution

To configure a custom error page for Report Manager:

  1. Browse to Report Manager folder.
    • For SSRS 2005, its typical location is DRIVE:\Program Files\Microsoft SQL Server\MSSQL.x\Reporting Services\ReportManager, where x is the instance
    • For SSRS 2008 and SSRS 2008 R2, DRIVE:\Program Files\Microsoft SQL Server\MSRS10.SSRS\Reporting Services\ReportManager .
  2. Make a copy of the existing Web.config as backup
  3. Open Web.config in a text editor, or in Visual Studio to get Intellisense support
  4. Under the section, locate the `1 section
  5. Modify the existing section, or insert a new one, with the appropriate settings
  6. Restart the Report Server

The possible values for the mode attribute of the tag are Off, On, and RemoteOnly. The default is Off. In order to enable a custom error page, mode must be set to On or RemoteOnly. For example, the below section specifies the following: 1) a custom error page be displayed for remote users only, 2) a specific page for HTTP status code 500, and 3) a default page for all other HTTP status codes. Note that attributes are case-sensitive.

Blogged