Tag Archives: pitan

5 Underutilized Excel Features To Take Advantage Of

Let’s get straight to the point, because frankly who wants to waste any more time finagling your data and reports? The following are the top 5 Excel features I use on a constant basis to get the most out of my data.

For reference, you can download the example workbook I used in this post: Top5ExcelFeatures.xlsx

#5 – What-If Analysis

WhatIfAnalysis

I actually only started using this one recently, but it’s quickly become a favorite. I’m particularly fond of the Scenario Manager function. What-If Analysis is comprised of three pieces: Scenarios, Goal Seek, and Data Tables. 

Scenarios has the ability to define a scenario that is associated with a particular set of cell values. You can define new scenarios that are tied to different cell values. When a new scenario is loaded, all of the values update. This is great for flipping between Best Case and Worst Case views of a worksheet.

WhatIfAnalysis2

The other two pieces are Goal Seek and DataTablesIn Goal Seek, Excel automatically computes and finds a calculated value based on the value of another cell, such as finding an interest rate based on a monthly payment. Data Tables allows you to hook up entire tables of values based on up to two variables.

#4 – Sparklines

Sparklines

These mini-charts were released in Excel 2010 and they provide a quick way to Continue reading 5 Underutilized Excel Features To Take Advantage Of

How to select slicer values with VBA

PitanHeader_short

Hello, everyone, and welcome to another edition of Pitan Pivot Mage!

Today we will cover how to select slicer values with VBA. This is especially useful if you have a report generated by OfficeWriter’s ExcelTemplate model and you can’t select the slicer values in the template file.

Intro

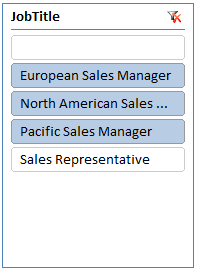
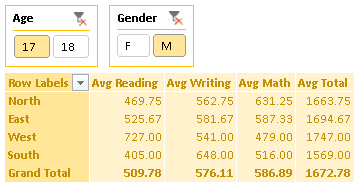
Let’s start out with an ExcelWriter report template. It has some data off to the side and a PivotTable that summarizes the test scores with averages. There are two slicers for filtering on age and gender.

Template

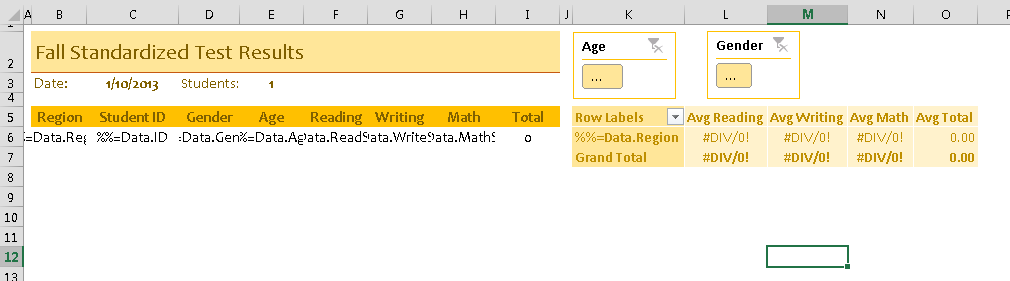
When it’s populated with data, all of the values in the slicers are automatically selected, so the default is a full view of the data.

RenderedReport

Writing the Macros

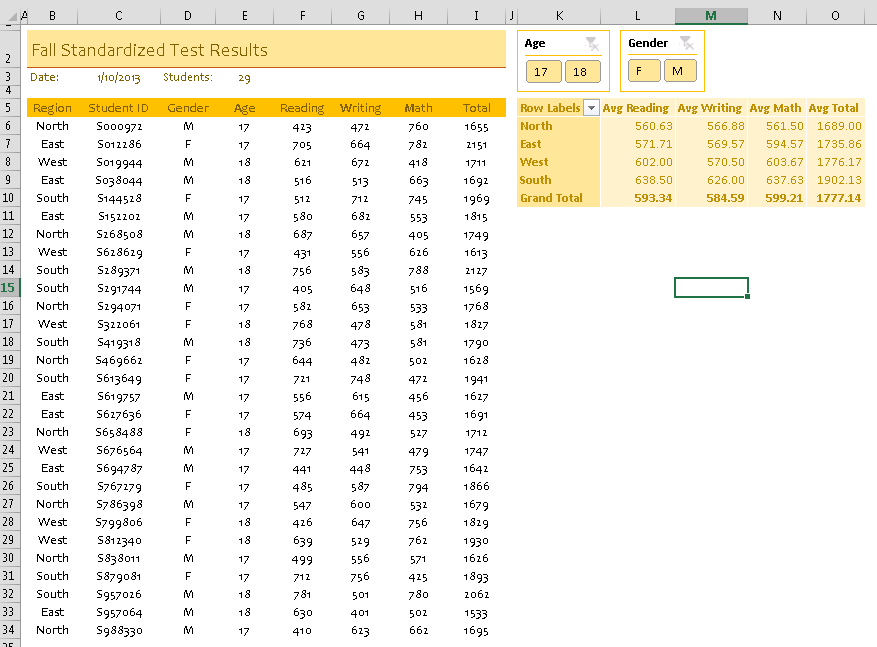
Whenever I need to write a PivotTable macro, I always start by recording myself performing the action I want and then generalize the code later. In this case, I want to select only “M” and “17” in my slicers for 17-year-old male students.

My first pass gives me some useful information:

RawMacro

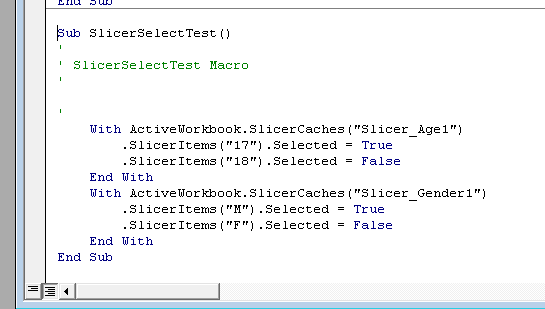
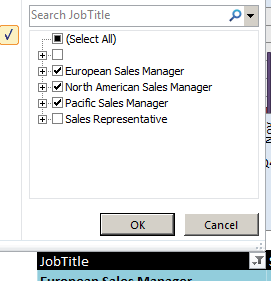
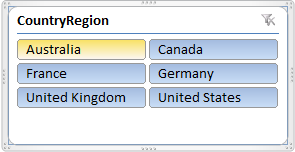
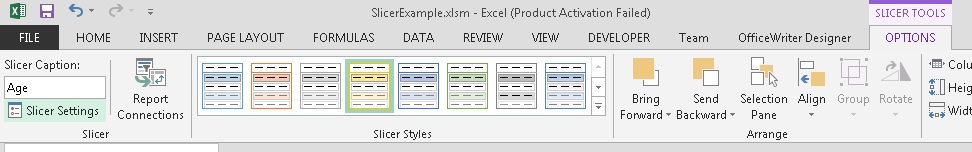
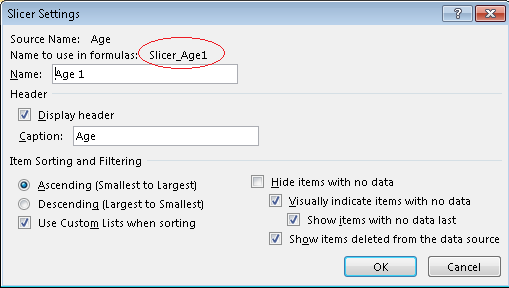
The first thing I notice is the slicer name “Slicer_Age1” and “Slicer_Gender1”. This is the name for the slicer for formulas and VBA. To find the name of your slicer, select the slicer and go to slicer settings. This is on the left, under slicer tools:

SlicerTools_Settings

The slicer tool dialog lists the name of the slicer, but also the Name to use in formulas. This is the programmatic name for the slicer that we’ll use in the macro.

Slicer_Programmatic_Age

Then I was able to generalize the macro to take a slicer name, value, and whether it should be selected or deselected:


'Selects or deselects a value (slicerVal) in a slicer (slicerName)
Sub SelectSlicerValue(ByVal slicerName As String,
ByVal slicerVal As String, ByVal isSelected As Boolean)
ActiveWorkbook.SlicerCaches(slicerName).SlicerItems(slicerVal).Selected = isSelected
End Sub

To make things easier for myself, I  created a subroutine that would select 17 and “M,” while deselecting 18 and “F.”

'Selects slicer values to display only data for 17-year-old male students
Sub SelectMale17Profile()
SelectSlicerValue "Slicer_Age1", "17", True
SelectSlicerValue "Slicer_Age1", "18", False
SelectSlicerValue "Slicer_Gender1", "M", True
SelectSlicerValue "Slicer_Gender1", "F", False
End Sub

Calling the Macros

To make sure that the macro runs when the workbook is opened, I called the subroutine in the Workbook_Open() code.


Private Sub Workbook_Open()
SelectMale17Profile
End Sub

Handling the PivotTable refresh

As outlined in our tutorial for how to use PivotTables with ExcelTemplate reports, the PivotTable needs to refresh in order for the imported data to display; the easiest way to do this is to set ‘Refresh on Open’ under PivotTable Data Properties. This poses a problem because macros in Workbook_Open() execute before the the PivotTable refresh and the slicer macros will be unable to find the values to select. This results in a run-time error.

To avoid this problem, I wrote a quick macro that refreshes the PivotTable:

'Refreshes the PivotTable as a replacement for the 'refresh on open' property
Sub PivotTableRefresh(ByVal pivotTableSheet As String, ByVal pivotTableName As String)
ActiveWorkbook.Sheets(pivotTableSheet).PivotTables(pivotTableName).PivotCache.Refresh
End Sub

And added it before the slicer code in Workbook_Open().

Private Sub Workbook_Open()
'Refresh the PivotTable with a macro because it may not refresh first
PivotTableRefresh "Template", "PivotTable1"
'Select the desired slicer values
SelectMale17Profile
End Sub

There you go!

SelectedProfile

Downloads

A copy of the template file with the macros, a sample output file, and the code used to populate the template file are available for download here as a zip file.

Getting started:

Learn more about ExcelTemplate or try it out in a free trial of OfficeWriter today.

    
 OR     


Meet the Team: Alison

Hello and welcome to our Meet the Team series, in which we aim to give you deeper insight into the minds and personalities of those who make up this eclectic, close-knit group. We are developers, marketers, and technical support engineers, and at work we craft everything from Microsoft reporting APIs to mobile email applications. And outside of work? Let’s just say racing against the machine during hackathons, building architecturally sound beer towers during retros, and paddling down the Charles during the warmer months are simply the beginning.

Say hello to Product Manager Alison – belovedly known as author of the Pitan the Pivot Mage series. When she’s not supplying delicious office treats, you can find her scrumming in Trello, pumping out Pitan posts, or answering your questions on the OfficeWriter Answers site.

1. What do you do?
That depends on which hat I’m wearing. On Monday, I write tutorials. On Tuesday, I shift to designing sales demo or web site content. By Wednesday I’m managing a product backlog. Thursday is all about answering technical support questions and writing sample code. I wrap it up on Friday with some PivotTable blog posts.

2. What are you listening to right now?
I’m oscillating between the action theme from Doctor Who and the opening to an anime, Aquarion Evol.

3. If you could build any app, what would it be and why?
I would definitely want to build a mobile app that could analyze a reference picture of a character and generate a list of color swatches from the images. On top of that, it would allow you to switch between ‘picture colors’ and ‘real life colors’. For example, a bright yellow in a cartoon image would correspond to a golden blonde in real life.

4. When you were 5 what did you want to be and why?
I wanted to be a marine biologist because that was the perquisite for training Orcas at Sea World.

5. If you were a beer what would you be and why?
Apple juice – because I don’t drink and no one would be able to tell the difference visually.

6. What is your favorite tech blog and why?
Contextures has all my answers when PivotTables stump me. Continue reading Meet the Team: Alison

Run-time error 1004 with PivotItems

I was working on some VBA code to hide all the values for a particular report filter, except for a specific one. The code looped through all the pivot items for a particular field, turned them off and then turned the one I wanted back on.

Sub SetFilter(ByVal Worksheet As String, ByVal pivotTable As String, ByVal pivotField As String, ByVal selectValue As String) 
      Sheets(Worksheet).Select 

      Dim pvtTable As pivotTable
      Set pvtTable = ActiveSheet.PivotTables(pivotTable) 

      Dim pvtField As pivotField 
      Set pvtField = pvtTable.PivotFields(pivotField) 
     For Each filterValue In pvtField.PivotItems 
          filterValue.Visible = False 
     Next 
     pvtField.PivotItems(selectValue).Visible = True 
End Sub

While testing the code, it worked until it hit the last filter value, at which point it would throw an exception: Continue reading Run-time error 1004 with PivotItems

PowerPivot Part 4: Sharing PowerPivot Workbooks

So now you have a PowerPivot workbook that’s far too awesome to keep to yourself. How do you go about sharing PowerPivot workbooks?

You could just distribute the workbook wholesale, but that’s not optimal because any user who wants to take advantage of the PowerPivot features needs to have PowerPivot for Excel 2010 installed on their machine to fully run the report.

Where else can you turn?

Luckily, SharePoint 2010 introduced PowerPivot for SharePoint that is comprised of two main pieces:

  • Server software that can retrieve the data for the report
  • The PowerPivot Gallery

The SharePoint PowerPivot Gallery is a special document library that has document management and preview for PowerPivot workbooks (along with a few other document types). With the PowerPivot Gallery’s live preview, you can interact with a PowerPivot workbook, just as you would in Excel.  You can also create workbooks from published PowerPivot workbooks and schedule data refreshes for added versatility. The gallery also has several customization options for how the reports are listed.

What’s the catch?

Continue reading PowerPivot Part 4: Sharing PowerPivot Workbooks

PowerPivot Part 3: Slicers

Hello everyone, Pitan here! This is the third chapter of my PowerPivot epic. Read the adventure from the beginning with PowerPivot Part 1: Bringing Data Together or continue on to your regularly scheduled programming with slicers!

Okay, so technically slicers aren’t specific to PowerPivot, but they are new to Excel 2010. Chances are if you are working with PowerPivot, you’ll want to know about slicers.

What is a slicer?

A slicer is a visual representation of a filter applied to your PivotTable or PivotChart. Rather than having to use the drop-downs for report filters, column labels, or column rows like this:

You can have an aesthetically pleasing slicer to show you at a glance what data is filtered:

How do slicers work?

Continue reading PowerPivot Part 3: Slicers

PowerPivot Side Quest: How to Format a Slicer

Pitan here! In Part 3 of my PowerPivot blog series, I cover how to add slicers to a PowerPivot report.
This post covers how to format slicers in Excel 2010 – in particular, how to create a custom slicer style that can be applied to multiple slicers.

The first step is to select the slicer to activate Slice Tools tab in the ribbon.

There are default styles available, but in this case we want to make a customized slicer style. You can create a new style from scratch:

But you may find it easier to clone the style and then modify the style properties, which is what we will do in this example. Here is the slicer with the unmodified clone of the style:

Continue reading PowerPivot Side Quest: How to Format a Slicer

PowerPivot Part 2: Copying PivotTable Functionality

Pitan here! This is Part 2 of my series on PowerPivot, which started with looking at how PowerPivot handles data. This time we’re covering similarities and differences between PowerPivot and regular PivotTables.

PowerPivot offers all the existing functionality of PivotTables with stronger backend support for data sources. Most of PowerPivotTables is exactly the same as regular PivotTables, but there are a few minor differences. So rather than tell you how to create PivotTables with PowerPivot, since you should theroretically be able to reuse your existing PivotTable know-how, I’m going to focus on some of the differences that threw me for a loop.

Refreshing Data

If you’re familiar with PivotTables, then you probably know that if you make changes to the original data for your PivotTable, you have to refresh the PivotTable in order to see those changes take effect.

PowerPivot is no different, except that it’s a bit more explicit. When you refresh the data in PowerPivot for an existing PowerPivotTable, the PowerPivot field dialog will tell you that the PivotTable also needs to be refreshed.

It’s easy to forget that refreshing PowerPivot doesn’t refresh everything, but at least Excel constantly reminds you.
Continue reading PowerPivot Part 2: Copying PivotTable Functionality

PowerPivot Part 1: Bringing Data Together

Hello everyone, Pitan here! I’ve finally had the chance to get my head around PowerPivot, the new Excel 2010 add-in for grabbing, pivoting, and displaying data. The chronicles of my journey to set up my own PowerPivot report will be revealed in a series of blog posts over the coming weeks. Tune in as I give you some HOW-TOs with a healthy dose of side commentary!
Continue reading PowerPivot Part 1: Bringing Data Together

Adding a % of Total Column to a PivotTable

Intro

A customer recently asked for some help with adding a % of Total column for sales data without a pivot table (read about it with Excel and with ExcelWriter). But I wanted to see how the same table and column would be done with a pivot table. Enter Pitan, the Pivot Mage and here we go!

Solution

We start with a basic pivot table that already has the store names as row labels and the sales data as the data values. We want to add a column that shows each stores’s sales totals as a percentage of the sales total over all the stores.

1. Add a duplicate column of the values that you want to show the percentages for. In this case, it’s “Store Sales”, so there will be two columns of “Stores Sales”: one for displaying the raw values and one for calculating the percentages.

2. Display the field values as % of Column Total. This can be done two ways:

  • Right click on the field > Show Values As > % of Column Total
  • Use Value Field Settings to format the field
    1. Go to the field in the field view
    2. Select ‘Value Field Settings’ from the drop down
    3. Go to the Show Values As tab
    4. Select % of Column Total


3. (Optional) Rename the field as desired (from Value Field Settings)

4. Congratulations!

For more information about different field calculations, see Microsoft’s article on how to Calculate values in a PivotTable Report.