Learn how OfficeWriter can put data in the hands of your business users.
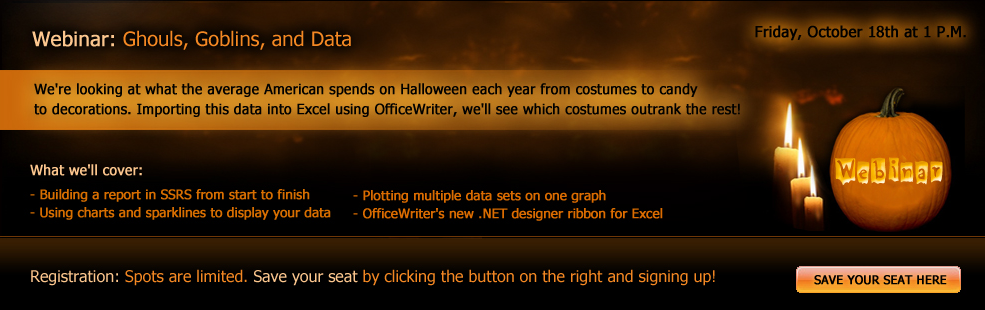
When: Friday, October 18th at 1 P.M.
In this webinar:
We’re looking at what the average American spends on Halloween each year from costumes to candy to decorations. Importing this data into Excel using OfficeWriter, we’ll see which costumes outrank the rest. Is it Miley Cyrus, your favorite decade garb, or the ever-popular witches and ghosts? We’ll find out, along with what Americans spend on these once-a-year ensembles, mounds of candy, and gobs of decorations. You’ll take away new tricks for creating reports in Excel and maybe a DIY Halloween costume idea or two.
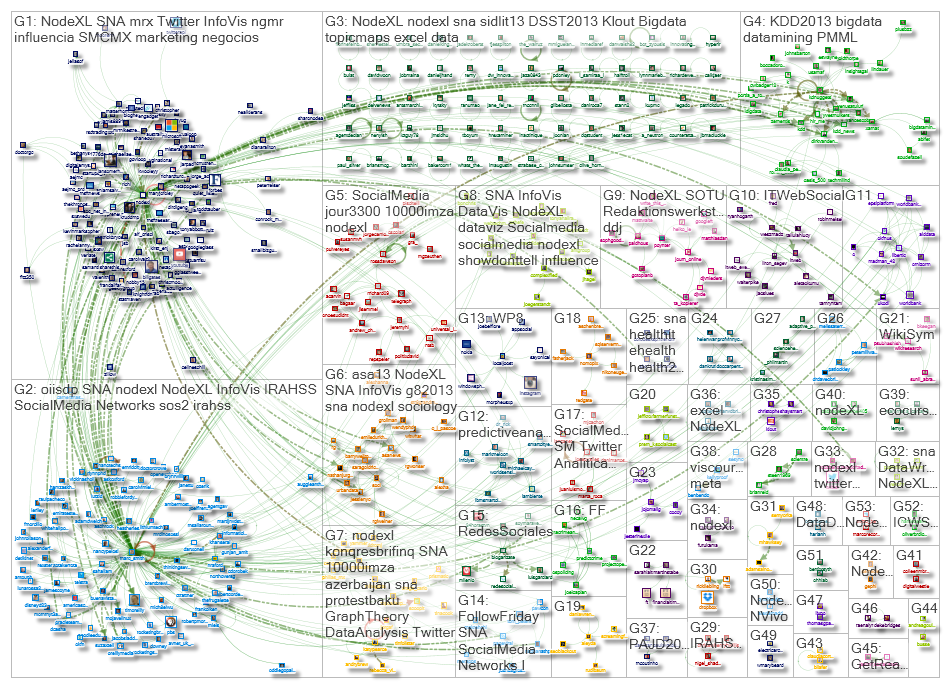
Analyzing and presenting your data is a daunting task. OfficeWriter makes it easier. Next week, we’re making it easier still with a new webinar on data visualization. Joining us is special guest Marc Smith, creator of NodeXL.
Marc Smith is the Chief Social Scientist at Connected Action Consulting group. Prior to that he worked at Microsoft Research, where he created NodeXL, an Excel add-in, which allows you to import and visualize your social network data, anything from email to Twitter to Flickr and beyond.
In this webinar you will learn:
The origins of NodeXL and what it could mean for businesses in regards to social networks
How to find the connections and patterns within your social network communities
How to use NodeXL to graph the connections between trending Twitter conversations
Q&A with Marc Smith
Leave with new ideas on graphically representing your data, and see how social can impact your business.
When: September 11, 2013 at 1 P.M. EST/10 A.M. PST
*Register early as seating is limited. Can’t attend? Register anyway and we’ll send a copy of the slides and recording following the webinar. Just be sure to write “Request for slides” in the notes section, so we have an accurate head count. Thank you!
In preparation for our webinar this Friday on music trends, we put together a Monday playlist to give you a peek inside what’s playing at our desks and through our headphones.
Haven’t registered for the webinar yet? What are you waiting for? Find out how we’re using music data to show you ways to make your Excel reports hit all the right notes.
Take a look at how OfficeWriter can turn your drab Excel reports into chart-topping spreadsheets. This month, it’s all about music as we cover your favorite bands, artists, and labels.
In this webinar we’ll cover:
Grouping and nesting in Excel
Using SQL Server Reporting Services (SSRS)
Charting in Excel and relationships between genre, artists, labels, and album price
When: Friday, August 23, 2013 at 1 P.M. EST
*Register early as space is limited.
Can’t attend? Register anyway, and we’ll send a copy of the slides and recording following the webinar.
Baseball has long been associated with using stats to predict outcomes and player performances. This was made famous in the movie Moneyball, and has its own cottage industry around helping fantasy baseball players perform better. There is no shortage of information that can be gathered about baseball, with the whole industry even having deemed the term: sabermetrics.
Before jumping into the vastness of data, however, I want to point out where we are getting the data from. There are many different sources for baseball stats, many requiring a fee, but I will be referring to the Sean Lahman Baseball Stats Database. It is open source, so you can just download a version that works for you, and run with it. I am only going to look at the players who have actually appeared in the All-Star game and their year’s performance.
The other source of data is the year-to-date stats for the All-Star players. These can be gathered from the many, many sports sites (like ESPN.com), but is a manual process. I will leave it as an exercise for the reader to copy and paste those! You can find the sum of those in the example file attached.
Just to simplify things, we are going to use the old standbys: Earned Run Averages (ERA) and Batting Averages (BA) to compare the two Major League Baseball leagues. The other consideration is to analyze data from just the “Long Ball Era,” which started in 1994. Since the sport has been around so very long, it helps to categorize the data so you get a better apples-to-apples comparison.
The first step is to get the data into your database. I used the Access file download, since SQL Server 2008 R2 can import that directly, and you don’t have to do any of the conversions. The data is also available in CSV and MySQL format. Now that we have a nice almost relational database, all we need are a couple of SQL statements to get the data for our processing needs. (They have been attached for reference.)
Tune in next week Friday, June 28, 2013 at 1 P.M. for our June webinar as we give you another inside look at how OfficeWriter enhances SQL Server Reporting Services (SSRS), making your reports a home run. Senior Sales Engineer, Chad Evans, will walk you through using both single and multi-value parameters and formulas in SSRS. Using baseball data on players’ batting averages and salaries, this webinar is sure to impress. Don’t miss out! Seating is limited.
*Can’t attend? Register anyway, and we’ll send a copy of the slides and recording following the webinar.
With data sets tied to different data sources and multiple people handling one report, the process of building a report can get messy. OfficeWriter’s built-in Designer Ribbon makes it easier to interact with SQL Server Reporting Services (SSRS), helping you access reports from your applications on time and with ease. Join us Friday, March 22nd as our Senior Sales Engineer, Chad Evans, shows you how this feature makes using SSRS simpler.
In this webinar you will learn:
How to build an SSRS report from start to finish using the OfficeWriter designer ribbon
How to easily open existing reports, create new ones, and view reports in process with SSRS
We will also have a question and answer period at the end of the webinar. Feel free to send in questions prior to the webinar so that we can include them in the presentation.
When: Friday, March 22nd at 1 P.M. EST
Can’t attend, but still want a copy of the recording and slides? Register below and we’ll email it out following the webinar.
**Spots are limited. So please register early to secure your seat.
Our Senior Sales Engineer (and adept demo master), Chad Evans, will walk you through several ways PivotTables can help you wrangle and report on your data. Bring your questions or email them beforehand and we’ll be happy to include them.
When:
Friday, March 1, 2013 at 1 p.m. EST
What we’ll cover:
How to use PivotTables to better sort and filter your data
How to programmatically create Excel PivotTables in OfficeWriter
How to programmatically update existing Excel PivotTables in OfficeWriter
Our Senior Sales Engineer (and adept demo master), Chad Evans, will walk you through several ways PivotTables can help you wrangle and report on your data. Bring your questions or email them beforehand and we’ll be happy to include them.
When:
Friday, February 22, 2013 at 1 p.m. EST
What we’ll cover:
How to use PivotTables to better sort and filter your data
How to programmatically create Excel PivotTables in OfficeWriter
How to programmatically update existing Excel PivotTables in OfficeWriter