Category Archives: Big Data

How I Learned to Love My Data: Gobbles and Gobbles of Data

Love your dataLet me preface this by saying I am a communications major, a lover of language and all things related to the humanities, following the auspices of the left brain. Science, statistics, numbers, data – that was for my logically-minded friends. Attending a research university, I was constantly surrounded by studies, which as you guessed it, are based off of piles and piles of data. It’s not that I didn’t understand the importance of data, it’s that I just never loved it. As a communications major I tended to shy away from numbers. (Okay, more like run flailing in the opposite direction as though my life depended on it.) Turns out numbers are a very real part of marketing, if not the crux of every marketing campaign. It allows you to measure what is working for your goals and what needs adjustment.

Generally speaking, I love the insights it gives, the conclusions it reaches. I just don’t enjoy the process of data collection in order to reach those conclusions. But who does? With data tied to many different sources, and housed in varying formats, it’s not easy to make it come together in one simple report. I’d like my data handed to me, preferably on a silver platter. Yes, well, that’s not how it works. And that’s not how it should work. In order to really understand the insights and not be misled by false assumptions, you should be able to understand where this data is coming from, how things are being measured, and what the goals are behind it.

Working at a software company, whose product deals with a ton of data and is designed for companies processing it to perform their reporting, I’ve had to become more comfortable with it. In any job this is a valuable skill to possess. Being able to deliver reports and present your work and results to the company/client/manager is a very necessary part of any business, and one that CEOs and execs place a lot of stake in. Not only that, it puts a tangible number to your work you can point to, to assess improvements and successes.

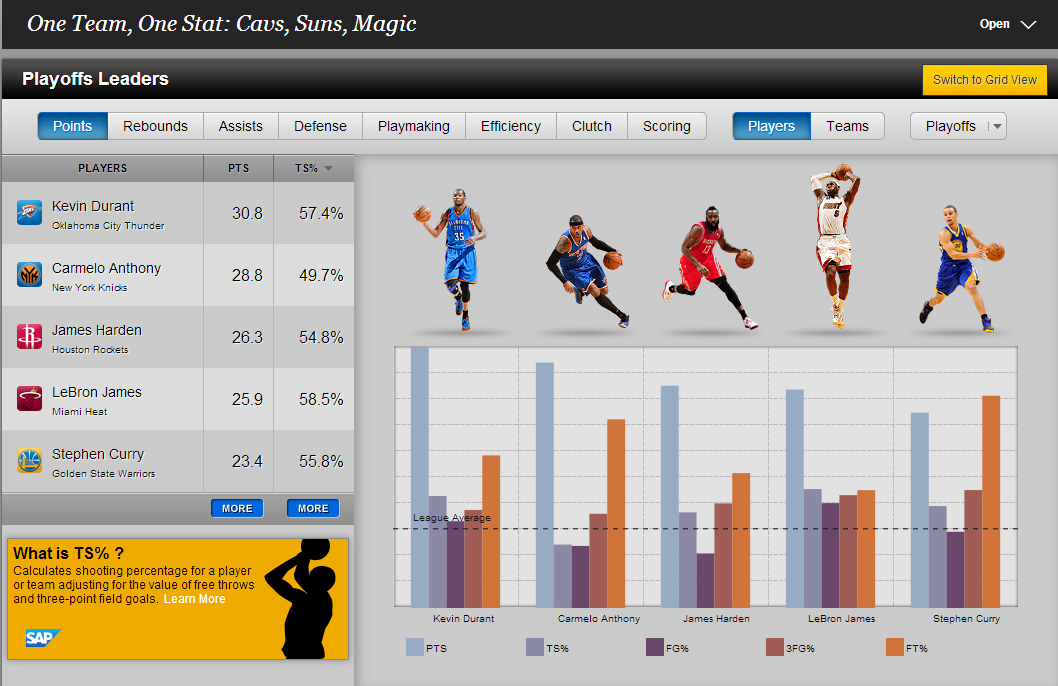
While there is this necessary business side to data collection, that doesn’t have quite the same motivation to learning to fully appreciate it. As I dove deeper into the weeds – spreadsheets, SSRS, Big Data, dark data, and servers – I discovered the ways in which people were using these numbers, the artful approach to using and displaying the information that is being collected. My coworkers showed me spreadsheets can be the springboard for masterpieces (see: Baking Cookies in Excel and Making Art with Excel). Speaker and data visualization blogger, Cole Nausbaumer, showed me you can infuse creativity into numbers. In her Storytelling with Data blog, she shows the meshing of the creativity behind presenting your data in a way people can relate to and process it: the age old art of storytelling. Now that is something to which I can relate. (If you haven’t yet, you should read her blog, and pick up tricks on data visualization.)

Along the same lines of displaying your data, Continue reading How I Learned to Love My Data: Gobbles and Gobbles of Data

Creative ways companies are making use of Big Data

From art to cancer patient care, consumer goods to the NBA, Big Data is piling up and these companies are finding ways to make sense of it all. Scroll through the slideshow below to find out how.

Through the above examples of striking visualizations to interactive user experiences, we’re seeing companies and individuals find unique ways to leverage the data and insights being collected daily. How are you seeing Big Data used within your industry? Do you have any examples? Let us know!

Continue reading Creative ways companies are making use of Big Data

Webinar: Data Visualization and NodeXL and Marc Smith

nodeXLgraphAnalyzing and presenting your data is a daunting task. OfficeWriter makes it easier. Next week, we’re making it easier still with a new webinar on data visualization. Joining us is special guest Marc Smith, creator of NodeXL.

Marc Smith is the Chief Social Scientist at Connected Action Consulting group. Prior to that he worked at Microsoft Research, where he created NodeXL, an Excel add-in, which allows you to import and visualize your social network data, anything from email to Twitter to Flickr and beyond.

In this webinar you will learn:

  • The origins of NodeXL and what it could mean for businesses in regards to social networks
  • How to find the connections and patterns within your social network communities
  • How to use NodeXL to graph the connections between trending Twitter conversations

Q&A with Marc Smith

Leave with new ideas on graphically representing your data, and see how social can impact your business.

When: September 11, 2013 at 1 P.M. EST/10 A.M. PST

*Register early as seating is limited. Can’t attend? Register anyway and we’ll send a copy of the slides and recording following the webinar. Just be sure to write “Request for slides” in the notes section, so we have an accurate head count. Thank you!


Carpe Datum: How to Export Your GMail to Excel

Credit: Hongkiat.com

[Crossposted from Riparian Data]

Straightforward title, straightforward goal, ugly and roundabout (but free!) method of achieving it.

For some time now, I’ve had this goal: download my gmail data, analyze it, and visualize it.

The last time I tried this, I glossed over the whole getting your gmail data into Excel part. This is because I wasn’t able to do all of it myself–Jim had to take my ugly mbox data and make it Excel-readable.

But now, thanks to the basic python skills acquired in my data science class, I can do everything myself! Kinda. The code in part 3 will probably make a real programmer scream, but for the most part, it works–though it’s not fond of commas in subject lines. And if you, like me, are not a programmer–don’t worry! You can still run the code, using my trusty copy/paste/pray methodology.

Alors, here goes:

Step 1: From Gmail to Apple Mail

You have Apple mail, right?  You can also do this with Outlook, and probably other desktop clients.

1) In your Gmail settings, go to the “Forwarding and POP/IMAP tab” and make sure POP is enabled.

2) Now, add your Gmail account to your desktop client o’choice. If it’s already there, add it again–you’re going to be removing this one.

Important: Do not check the “remove copy from server after retrieving a message” box!

Step 2: From Apple Mail to mbox

This part is easy. Just select your mailbox in the desktop client, and go to Mailbox->Export Mailbox, and choose a destination folder.

Step 3: From mbox to csv

If you try to save your pristine mbox file as a csv, you will get a one column csv. Don’t do that. Instead, use these python scripts (also up on github).

The first script opens a blank csv file, and fills it with the subject, from, and date lines for each message in your mbox. I called it mbox_parser.py.

import mailbox import csv
writer = csv.writer(open("clean_mail.csv", "wb")) for message in mailbox.mbox('your_mbox_name'):     writer.writerow([message['subject'], message['from'], message['date']])

If you don’t know what python is, you can still run this script. Here’s how:

1) copy the above code to a plain text file, and save it as mbox_parser.py. Save it to the same folder you saved your mbox file to.

2) open your terminal (spotlight–>terminal)

3) type cd Users/your_account_name/directory_where_you_saved_your_mbox,

4) type  python mbox_parser.py

5) Voila! In your directory, you should see a new file, cleaner.csv.

You’ll notice that the ‘date’ column is a long, jam-packed date string. It’ll be much easier to Continue reading Carpe Datum: How to Export Your GMail to Excel

Quantify Me: The Rise of Self-Tracking

Credit: Syncstrength.com

“Have you heard of the quantified self?” my coworker asked me.  After a puzzled stare and a furrowed brow I assured her I hadn’t. So of course I immediately clicked over to a new tab and typed “quantified self” in the browser. Turns out I had heard of this concept, I’d just never put a name to it. In fact, I’d been partaking in this movement for years – tracking my whereabouts with Foursquare, logging my calorie intake with MyFitnessPal and recording my workouts with RunKeeper. I even had a stint with Saga, the app that tracked your every single move without you having to do anything! Just install the app and let ‘er rip.

There are a ton of apps and wearable devices dedicated solely to this purpose of tracking and quantifying oneself, all with the ideal goal of finding correlations and being able to improve upon your productivity, fitness, and overall well-being. The Zeo monitor straps to your head, monitors your sleep cycles, and comes equipped with a programmable alarm clock that wakes you at the optimal phase of sleep. Adidas has a chip called miCoach you place in your shoe and it will record your speed, subsequently breaking down your recorded data graphically on their website. Samsung hopped on this trend and partnered with Foursquare to visually capture your whereabouts with their Foursquare Time Machine. Of course curiosity got the better of me and I gladly gave them access to my Foursquare check-ins. Take all of my data, Samsung! Link all of my accounts? Suuure. The more the merrier. Just remember to spit back a cool interactive image so I can see all of my data.

I’m not alone in my curiosity. It was reported last year that wearable monitoring devices raked in an estimated $800 million in sales. And it doesn’t stop there. IMS Research projects that the wearable technology market will exceed $6 billion by 2016. People are buying into this self-tracking movement. So why the obsession?

Continue reading Quantify Me: The Rise of Self-Tracking

Welcome Back, Privacy Concerns: Big Data, Healthcare, and PRISM

Photo Credit: Mashable.com

I suppose I shouldn’t say, “Welcome back, privacy concerns,” as I’m sure they never left, just quietly assumed their position humming in the background and shadows of the internet noise. This week, however, they took center stage both in the healthcare space and in government news.

This week, The New York Times published an article on a significant announcement for the healthcare industry. A group of global partners spanning 41 countries and including 70 medical, research and advocacy organizations agreed to share a heap of genetic data. “Their aim is to put the vast and growing trove of data on genetic variations and health into databases that would open to researchers and doctors all over the world, not just to those who created them,” The New York Times wrote. Currently, research labs and facilities are very much siloed. Each institution has their own research within their own walls and with their own records and system of operations. There is no universal method for representing and sharing genetic data, which could lead to advanced findings in cures and other health-related research.

One reason for the lack of a central system is the sheer volume of data. There is just too much information being produced by the minute. Not only that, but it is often unstructured and not of quality (meaning information was entered or gathered incorrectly/differently, such as January being entered in as Jan, 1, 01, or January, making it difficult to analyze). While volume and quality of data is an issue, the overarching problem, or rather challenge, healthcare professionals face lies mostly in the security space. With all of that sensitive patient data, there need to be strict, infallible measures to protect that information. Along those same lines is the question of who will have access to that information.

This is especially significant as it comes at the same time of privacy concerns regarding the NSA’s reported access to granular consumer data. Continue reading Welcome Back, Privacy Concerns: Big Data, Healthcare, and PRISM

2013 Business Intelligence Trends

Credit: e-bcorp.com

A few weeks ago we posed the question of whether or not Excel had the staying power to be the next great Business Intelligence tool. An overwhelming percentage of readers said yes. This week we decided to delve further into what else is on the horizon for the Business Intelligence arena.

Each year experts and industry leaders make their predictions on what lies ahead on the Business Intelligence landscape. We’ve distilled those predictions down to ones that appeared several times over. Looking at TechTarget, InformationWeek, Forrester, and Tableau Software, we scoped out the top Business Intelligence (BI) trends for 2013 and this is what we discovered.

  1. Cloud BI – The cloud isn’t going anywhere. It still has a lot of attention, despite the reliability, performance, availability, and privacy concerns from your IT department. The cloud’s ability to adjust to larger and larger data sets and petabytes of information makes it attractive for the Business Intelligence arena. TechTarget doubts moving infrastructure to the cloud will become mainstream in 2013, but that it is definitely destined and headed in that direction.
  2. Big Data – Big Data still gets big talk. Forrester predicts a rise in Hadoop-based BI applications, particularly within the mission-critical applications. Along those same lines, Forrester sees Big Data moving out of silos and into enterprise IT. They see enterprise IT becoming more involved with enterprise BI in order to save on the costs it takes to manage Big Data.
  3. Self-Service BI – We’re seeing it with the addition of Powerview to Excel, the desire for people to be in charge of their own data with less of a reliance on IT support to pull information and make business decisions. Forrester cited: Continue reading 2013 Business Intelligence Trends

Big Data and OfficeWriter

Big Data Demos
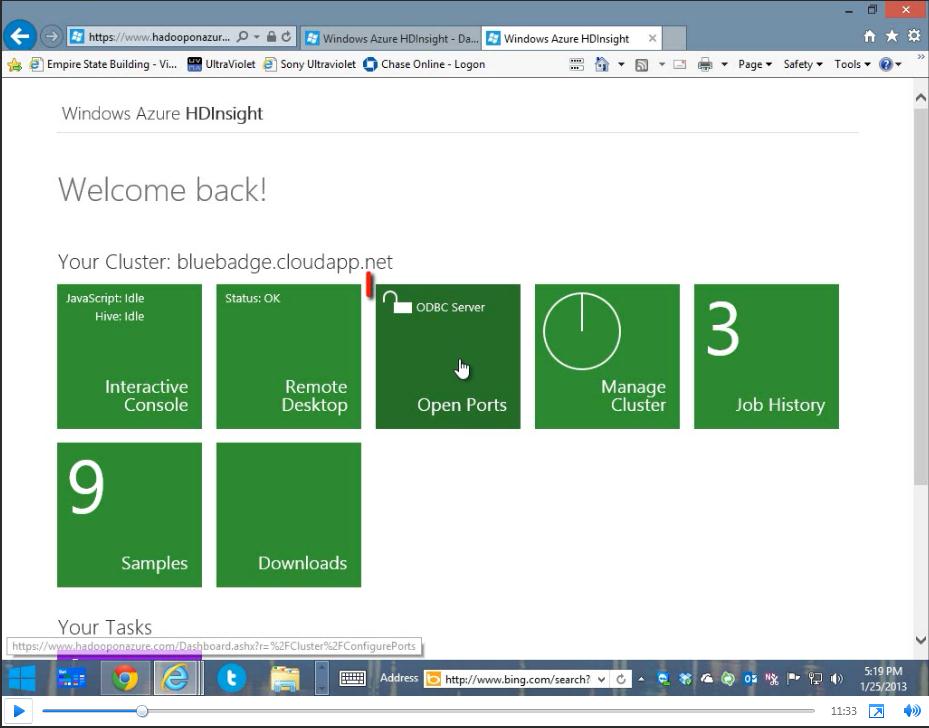
We partnered with Andrew Brust from Blue Badge Insights to integrate OfficeWriter with Hadoop and Big Data. Taking existing OfficeWriter sample projects, Andrew discusses how he created two demos showing OfficeWriter’s capabilities to work with Big Data. One demo uses C#-based MapReduce code to perform text-mining of Word docs. The other demo focuses on connecting to Hadoop through Hive.

In these demos you will learn:

  • How OfficeWriter integrates with Hadoop and Big Data
  • How to use ExcelWriter with Hadoop


Best Practices for Performance Testing

Credit: tucowsinc.com

This week I set out to add performance testing to a project I’ve been working on. Why performance test? The main benefit is that we can hone in on when one of the changes we’ve made to a project has affected performance dramatically (such as memory usage, run-time, etc.). It gives us the ability to review performance historically and subsequently identify areas of improvement.

The catch with performance testing is that run-time can vary between runs, making it tricky to test. There are a couple ways to tackle this problem:

  1. The first of which is to run each performance test multiple times and average the results; then compare it to the previous run. This is the most accurate way to go about it, but not necessarily the most cost effective way to spend your time. For instance, if your performance tests take 30 minutes to complete and you need 10 runs to get a good average, that’s a 5 hour test.
  2. Alternatively, we can compare the results of a single test to previous runs and simply identify whether or not the test falls within a desired percent of our distribution. This doesn’t have quite the accuracy of the first approach, but if you don’t expect extreme performance changes it can be a viable option. The biggest downside to this approach is that you won’t necessarily detect deviations immediately.

Right now we don’t have the time to run each test multiple times, so we will be implementing our tests using the second method. For testing the run-time I created a simple function that takes a lambda expression as an argument, so usage would be something like this:

1 TimeExecution( () =>
2 {
3     DoWhatever();
4 };

The implementation ends up looking like this:

01 TimeExecution(Action action)
02 {
03     Stopwatch perfTimer = new Stopwatch();
04
05     perfTimer.Start();
06
07     action();
08
09     perfTimer.Stop();
10
11     _runtime = perfTimer.ElapsedMilliseconds;
12
13     // Store the time and assert failure
14 }

Continue reading Best Practices for Performance Testing

Big Data for Dummies. Big Daddy for Geniuses.

[The following is a guest post from our partner company Riparian Data and new intern and data-ist Brennan Full. Happy to have you on board, Brennan!]

I first heard the words “big data” while listening to the radio at the gym, the host’s voice guiding me over the precipice of a “hill” on my humming elliptical.  The words immediately brought me back to my “Sandler period” where Big Daddy was watched on repeat until one had reached comedic enlightenment.  It wasn’t until the 3rd mention of “zettabytes” that I finally came around and realized that this conversation was concerning the mountains of data humans create every day.  Disappointed, I changed the station. Months later, looking for marketing opportunities I came across an opening at Riparian Data, a company that works with “big data”.   Again, the flashbacks returned; Scuba Steve, tripping people in Central Park, teaching Rob Schneider how to read… I have got to find a way to work there!

Before my interview I began researching the company, shocked to find out that I was horribly mistaken/illiterate and that Riparian Data in fact had nothing to do with the magnum opus of my childhood.  I sat for hours, researching, working desperately to understand what this emerging technological field was all about.  Hours passed and I was no closer to grasping NoSQL.  Dejected, I turned to my worn copy of Big Daddy.  As I slowly descended into a meditative state it hit me, BIG DATA AND BIG DADDY AREN’T COMPLETELY DISSIMILAR!

You see, much like shapeless masses of data, Sandler’s character lacks purpose, that is until someone comes around and gives the data/“daddy” meaning.  Big data is the collection and analysis of the information we’re all constantly generating as we text, tweet, buy things, use GPS, etc.  This incomprehensible mountain of information would lack significance if not for the tools brought about by big data.  This, ladies and gentlemen is how my warped mind came to understand what big data is all about.

Thanks for having me on board Riparian Daddy!

NOTES: I never went through a Sandler period, I never use an elliptical, and I’m fairly certain Rob Schneider was acting like he couldn’t read.