All posts by Chad Evans

March Madness: Using Excel to Pick the Upset

Bracket Mania

It’s that time again! Time to get out the office pool and place all of your stock in one team to take you to the finals and earn you those much sought after office bragging rights. Last year, to aid in my bracket-making decision, I decided to write a way to be able to generate a randomized bracket for the NCAA college Men’s Basketball Tournament using Excel. This year, I dug a bit more into using an alternative method, the KenPom rating, to see if I could predict a better bracket. You can dig into this stuff endlessly (or so it seems), starting out with the source of the rankings at KenPom.com. KenPom.com is a college basketball statistics site that has been featured on FiveThirtyEight, Mediaite, and The Wall Street Journal for its predictions in game outcomes. Ken Pomeroy, the creator of the site, has statistics dating back to the 2003 season, and his research is used by many college basketball teams to gain a competitive advantage.

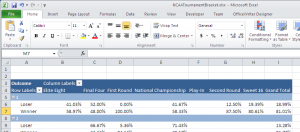
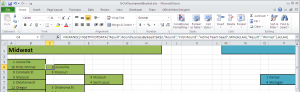
The bracket I made this year was built in a couple of different ways. First, I used the seed strategy, where a higher seed historically wins X% of the time. Second, I used KenPom to figure out how the match-ups might work based on a random outcome. This second method does allow for some very volatile outcomes, so use at your own risk!

I am attaching a project that goes into all of the details of generating the brackets, and I have updated it from last year to get the latest attempt to win some bragging rights.

Download the Brackets and Excel Spreadsheets

To see the completed Excel spreadsheet and my 2014 bracket picks, click the links below. May the odds be ever in your favor!

The full Excel file: NCAATournamentBracket
The C# project: TournamentBracket_2014
My tournament bracket: TournamentBracket_2014_Final

Note: To save the bracket, you need to turn off the auto-calculation feature. This is due to Excel always updating the RAND() output on each change. I recommend changing it to Manual Calculation, and using F9 to run it when you want new values. Don’t forget, this may eventually run through every possible outcome; let me know if you end up winning anything from this!

Predictions

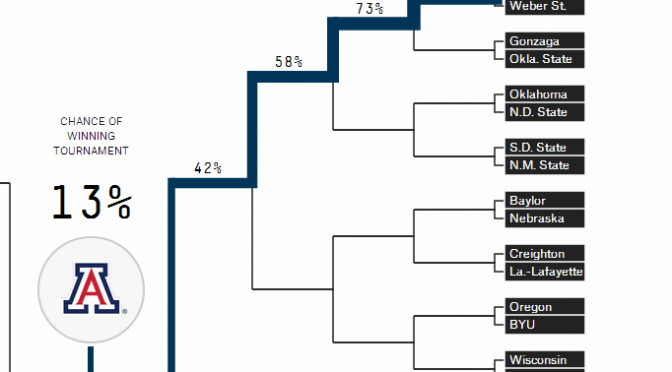
And the final prediction for this year is: Arizona wins it all.

Yes, the likelihood of me being correct is small, but given the current odds (6 / 1), I am feeling pretty good about it. Which does, of course, guarantee that this will be the incorrect bet.

Editor’s Note: Chad (the author of this post) hails from Arizona, so fair warning, there may be some home-state bias in this post.

Create your Holiday Cards with OfficeWriter, The Sequel

seasonsgreetingsThe holiday season is back! Stores are stocking their shelves with the season’s must-haves and calendars are quickly filling up with travel and office parties. With all the hustle, bustle and festivities, occasionally remember to send out those holiday cards and thank-you notes gets lost in the tinsel and taffeta. Well, you’re in luck, because this year we’ve put together a project for you to easily send out holiday thank-you notes and cards the nostalgic, old-fashioned way.

Last year, Sam showed us how to Automate Your Holiday Cards with OfficeWriter, and this year we’ve added thank-you notes to the mix. So you can spend less time on holiday prep and more time on the things that matter most – friends and family.

Using a few built-in tools with the .NET Framework, OfficeWriter, and templates, you can personalize every card for each one of your friends and family. See the example below. Then make your own by following these steps:

STEP 1 – DOWNLOAD OFFICEWRITER:

To get started, you will need to have OfficeWriter installed in order to be able to use the sample code below. In my solution, I used OfficeWriter and its built-in WordTemplate functionality to do a server-side mail merge. If you do not have OfficeWriter, you can download a free evaluation here.

STEP 2 – DOWNLOAD SAMPLE CODE:

Next, you will need the sample code. Download the sample solution here. This solution comes bundled with:

  • Sample code
  • Easily modifiable templates for holiday cards, mailing labels, and thank-you letters.
  • Dummy data from a Gmail Contact Export

Open the solution, run the generator, and you can see the three items:

SAMPLE OUTPUT:

SAMPLE CODE:

OfficeWriter makes it easy to generate the finished holiday cards, labels, and thank-you cards. With about 5 lines of OfficeWriter code for each template, within minutes you can go from nothing to a finished, picture-perfect file. The sample code below is a simple way to parameterize the code to handle all of our template files. Continue reading Create your Holiday Cards with OfficeWriter, The Sequel

Baseball’s All-Star Break: Predicting the Game Using Excel

Major League Baseball
Credit: Ampsportsduo.blogspot.com

In keeping with my sports theme from March, on March Madness and predicting the NCAA tournament, it is time to look at this season’s sport: Baseball. As you might know, Major League Baseball’s All-Star game is tonight, so let’s use Excel to pick which league (the AL or NL) will be victorious, so we can kick back and enjoy the game.

Baseball has long been associated with using stats to predict outcomes and player performances. This was made famous in the movie Moneyball, and has its own cottage industry around helping fantasy baseball players perform better. There is no shortage of information that can be gathered about baseball, with the whole industry even having deemed the term: sabermetrics.

Before jumping into the vastness of data, however, I want to point out where we are getting the data from. There are many different sources for baseball stats, many requiring a fee, but I will be referring to the Sean Lahman Baseball Stats Database. It is open source, so you can just download a version that works for you, and run with it. I am only going to look at the players who have actually appeared in the All-Star game and their year’s performance.

The other source of data is the year-to-date stats for the All-Star players. These can be gathered from the many, many sports sites (like ESPN.com), but is a manual process. I will leave it as an exercise for the reader to copy and paste those! You can find the sum of those in the example file attached.

Just to simplify things, we are going to use the old standbys: Earned Run Averages (ERA) and Batting Averages (BA) to compare the two Major League Baseball leagues. The other consideration is to analyze data from just the “Long Ball Era,” which started in 1994. Since the sport has been around so very long, it helps to categorize the data so you get a better apples-to-apples comparison.

The first step is to get the data into your database. I used the Access file download, since SQL Server 2008 R2 can import that directly, and you don’t have to do any of the conversions. The data is also available in CSV and MySQL format. Now that we have a nice almost relational database, all we need are a couple of SQL statements to get the data for our processing needs. (They have been attached for reference.)

On to building our Excel workbook. Continue reading Baseball’s All-Star Break: Predicting the Game Using Excel

March Madness: Predict Your NCAA Basketball Brackets with Excel

Every year in March, the NCAA hosts the college Men’s Basketball Tournament. Every year, I go through all of the teams, create my brackets, and see if I can do better than my friends. My one downfall is I always have my favorites: you know, the teams you follow because you went to school there, the team your significant other cheers for, your alma mater’s arch-nemesis, or the team with that really cool mascot. Whatever the reason, the biases end up costing you the first round, sidelining you out of the pool. What we need is a simple way to generate our bracket and remove some of that bias.

Instead of using a totally random outcome, let’s use a few of Excel’s analytical features to increase our chances of putting together a winning bracket. Let’s take Mens NCAA Basketball tournament data since 1985 (courtesy of The Washington Post‘s database), that has the history for specific seeds, teams, coaches and conferences – everything from each school’s tournament results to how No. 7 seeds have fared against No. 10 seeds in the first round. Using this data as a starting point allows us to inject reality into our random numbers. Because really, it is not ever worth considering if a 16 can beat a 1, right?

After copying and pasting the data from the webpage into an Excel spreadsheet, it’s time to input the formulas. It’s basically a two-step process. What we need to calculate is the probability of a particular seed winning or losing. If you hadn’t seen it before, a 9 seed beets an 8 seed more often than not, and a 1 seed has never lost. The pivot table I created reflects that, proving to be a useful tool in our selection process. It’s not too difficult to create a pivot table by seed and win/loss and by round for our source data. (See the workbook attached at the end of this post.)

First Pivot Table

Next, we develop a formula that uses the probabilities along with the RAND() function to predict the outcome of a match-up. All we need to do is apply the random number to the pivot table data to determine which of the two seeds advance to the next round. There is no easy way to do this, except with a long and complicated formula. Luckily, most of the formula is calculated by Excel by doing a simple click. The two Excel functions that get this done for us are the RAND() and the GETPIVOTDATA(). RAND() is well documented, but the GETPIVOTDATA() allows us to treat the pivot data like a database to get our probability for a seed to win the match-up.
Bracket

After playing with the output for a few runs, I noticed that the later rounds are fully dominated by the higher seeds. That happens because of the limited data for lower seeds in the later rounds. I want to allow for those Special Case teams to triumph over the Big League teams, so I added Continue reading March Madness: Predict Your NCAA Basketball Brackets with Excel

Enhancing your Word Document with Images Using OfficeWriter

One of the questions that comes up frequently when talking with customers is how can they get their images into their Word document with OfficeWriter? Depending on how you are using OfficeWriter and making your Word documents, there are a few ways to do this. The following outline several of these methods and cases in which to use them.

1. Design your document in Word with images

This is the easiest way to get images into your document. Since OfficeWriter can use the Word file you have already created and allow you to enhance it with data from a database, you can get all of the design functionality of Word with the enhanced capabilities of OfficeWriter. This method is commonly used when designing a document that uses your company logo, for example.

2. Dynamically insert images into a document

Another option is to design your document in Word, but leave a place holder for a dynamically loaded image. (A quick overview on how to do this can be found here.) This method is great when the document is structured the same each time it is run and you want to keep your company logo static, but use different department logos.

3. Design your report with images stored in a database

You can use one of two methods to directly insert images into a Word template from an image column: the placeholder method or the the image modifier method.  For example, in MS SQL Server, there is a column type “varbinary” used just for that purpose. This method is perfect for creating an employee directory containing the employee’s picture along with their contact information, or for a product catalog, showing the product alongside the product details. (For further details on how to to design your report with images stored in a database, please see our documentation on inserting an image.)

4. Design your report with images referenced by PATH in a database

This is the more complicated case of the bunch. Unlike the previous instances where you were obtaining your images directly from a database, this process involves accessing your images stored in another location, such as a network share. Continue reading Enhancing your Word Document with Images Using OfficeWriter