In keeping with my sports theme from March, on March Madness and predicting the NCAA tournament, it is time to look at this season’s sport: Baseball. As you might know, Major League Baseball’s All-Star game is tonight, so let’s use Excel to pick which league (the AL or NL) will be victorious, so we can kick back and enjoy the game.
Baseball has long been associated with using stats to predict outcomes and player performances. This was made famous in the movie Moneyball, and has its own cottage industry around helping fantasy baseball players perform better. There is no shortage of information that can be gathered about baseball, with the whole industry even having deemed the term: sabermetrics.
Before jumping into the vastness of data, however, I want to point out where we are getting the data from. There are many different sources for baseball stats, many requiring a fee, but I will be referring to the Sean Lahman Baseball Stats Database. It is open source, so you can just download a version that works for you, and run with it. I am only going to look at the players who have actually appeared in the All-Star game and their year’s performance.
The other source of data is the year-to-date stats for the All-Star players. These can be gathered from the many, many sports sites (like ESPN.com), but is a manual process. I will leave it as an exercise for the reader to copy and paste those! You can find the sum of those in the example file attached.
Just to simplify things, we are going to use the old standbys: Earned Run Averages (ERA) and Batting Averages (BA) to compare the two Major League Baseball leagues. The other consideration is to analyze data from just the “Long Ball Era,” which started in 1994. Since the sport has been around so very long, it helps to categorize the data so you get a better apples-to-apples comparison.
The first step is to get the data into your database. I used the Access file download, since SQL Server 2008 R2 can import that directly, and you don’t have to do any of the conversions. The data is also available in CSV and MySQL format. Now that we have a nice almost relational database, all we need are a couple of SQL statements to get the data for our processing needs. (They have been attached for reference.)
On to building our Excel workbook. My completed version is attached. First, we will deal with the Pitching calculation. The method to calculate the ERA is (# of Earned Runs) / (# of Outs Pitched * 3 Outs per Inning * 9 Innings per Game). This is done for each league. Batting works very similarly, but the calculation needed is for Batting Average, which is (# of Hits) / (# of At Bats).
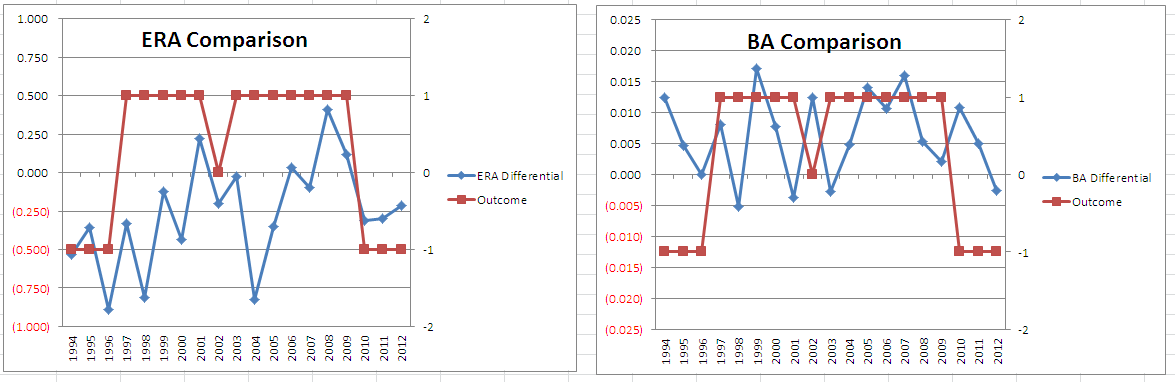
Before we continue, there are two items we need to address. First, we need a way to represent the outcome of the All-Star game. This can be done using positives for the American League (AL) winning, negatives for the National League (NL) winning, and zero for ties. Second, we need to compare the ERAs and BAs. I like to use a simple differential. So take (AL – NL) for the relevant metric.
Next, format them nicely and we have a working model of the data. Then we can start to see some patterns to help us predict the outcome.
Next, we tie the information about 2013 that we gathered earlier together with the working data model. If you added them to the database, you can do a UNION with the queries I have provided. Otherwise, just add the totals to the data above, and expand the charts and you get:
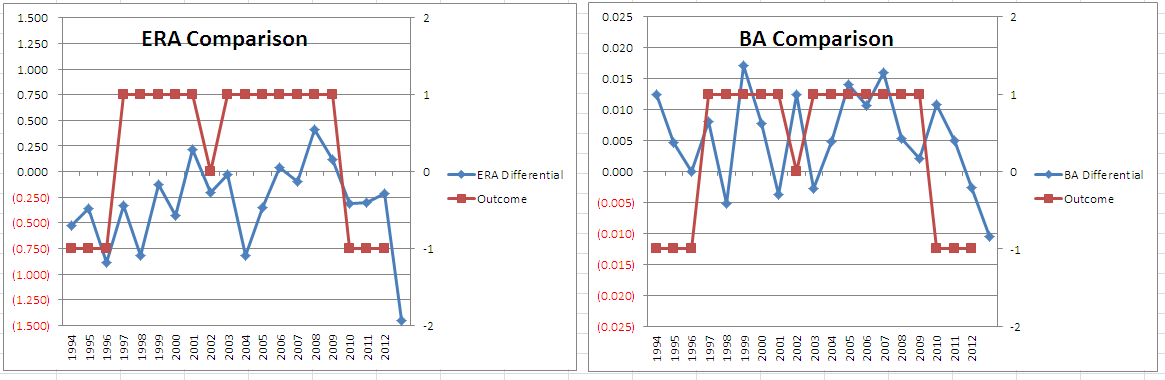
The prediction. The trend is that the NL has improved its pitching relative to the AL with the current crop of NL All-Stars and their performance-to-date as compared to their counterparts in the AL. Prediction: NL will be victorious.
Download the final Excel file here: All-Star 2013 Excel File
If you want to see how I automate this using SQL Server Reporting Services (SSRS) and OfficeWriter, check out the webinar on July 26th, where I will go through step-by-step how I put this together.

Share the post "Baseball’s All-Star Break: Predicting the Game Using Excel"
 Follow