Category Archives: Business Intelligence

When to use SUMIF vs. Pivot Tables in Excel

SUMIF and PivotTables can both summarize data based on specific criteria, but they do so in completely different ways. In most cases, PivotTables are going to be faster and easier to get the data that you want, but sometimes using Excel formulas is the only way to handle complicated data.

All the examples from this blog post can be found in this workbook: SUMIF_PivotTable

WHY PIVOT TABLES ARE BETTER

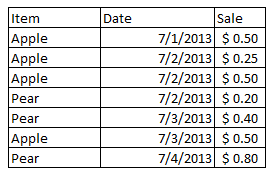
Let’s take a look at a quick example of some fruit sales data, where we want to find information like: all sales for a date, total sales for a fruit in the given time period, or total sales for a type of fruit on a given day.

ExampleData

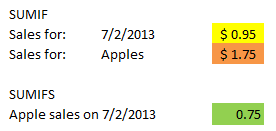
With SUMIF, you can specify the range of values you are using as the criteria (dates or fruit), the values you want to sum (sales), and the actual criteria that will determine if the values are included in the sum (“7/2/2013”, “Apple”). SUMIFS (new in Excel 2007) extends this functionality to allow multiple criteria (dates and fruit):

ExampleFormulas

Note: Excel also offers COUNTIF, COUNTIFS, AVERAGEIF and AVERAGEIFS starting in Excel 2007.

You can do the same with PivotTables, but the PivotTable will also handle sorting, grouping and organizing your data so you can just lift the aggregated values right out from the table:

ExamplePivotTable

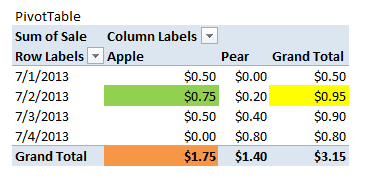
Here the values are automatically generated by the PivotTable. No extra work needed aside from creating the PivotTable, which is as easy as selecting the data range and specifying where the table needs to go.

Excel also applies PivotTable styles, which change be switched in one click and you can even create your own custom styles.

WHY WOULDN’T YOU USE PIVOT TABLES?

I extended my fruit example to use sample data from the AdventureWorks database, where I wanted to compare online and retail sales for North America, broken down by quarter: Continue reading When to use SUMIF vs. Pivot Tables in Excel

5 Underutilized Excel Features To Take Advantage Of

Let’s get straight to the point, because frankly who wants to waste any more time finagling your data and reports? The following are the top 5 Excel features I use on a constant basis to get the most out of my data.

For reference, you can download the example workbook I used in this post: Top5ExcelFeatures.xlsx

#5 – What-If Analysis

WhatIfAnalysis

I actually only started using this one recently, but it’s quickly become a favorite. I’m particularly fond of the Scenario Manager function. What-If Analysis is comprised of three pieces: Scenarios, Goal Seek, and Data Tables. 

Scenarios has the ability to define a scenario that is associated with a particular set of cell values. You can define new scenarios that are tied to different cell values. When a new scenario is loaded, all of the values update. This is great for flipping between Best Case and Worst Case views of a worksheet.

WhatIfAnalysis2

The other two pieces are Goal Seek and DataTablesIn Goal Seek, Excel automatically computes and finds a calculated value based on the value of another cell, such as finding an interest rate based on a monthly payment. Data Tables allows you to hook up entire tables of values based on up to two variables.

#4 – Sparklines

Sparklines

These mini-charts were released in Excel 2010 and they provide a quick way to Continue reading 5 Underutilized Excel Features To Take Advantage Of

2013 Business Intelligence Trends

Credit: e-bcorp.com

A few weeks ago we posed the question of whether or not Excel had the staying power to be the next great Business Intelligence tool. An overwhelming percentage of readers said yes. This week we decided to delve further into what else is on the horizon for the Business Intelligence arena.

Each year experts and industry leaders make their predictions on what lies ahead on the Business Intelligence landscape. We’ve distilled those predictions down to ones that appeared several times over. Looking at TechTarget, InformationWeek, Forrester, and Tableau Software, we scoped out the top Business Intelligence (BI) trends for 2013 and this is what we discovered.

  1. Cloud BI – The cloud isn’t going anywhere. It still has a lot of attention, despite the reliability, performance, availability, and privacy concerns from your IT department. The cloud’s ability to adjust to larger and larger data sets and petabytes of information makes it attractive for the Business Intelligence arena. TechTarget doubts moving infrastructure to the cloud will become mainstream in 2013, but that it is definitely destined and headed in that direction.
  2. Big Data – Big Data still gets big talk. Forrester predicts a rise in Hadoop-based BI applications, particularly within the mission-critical applications. Along those same lines, Forrester sees Big Data moving out of silos and into enterprise IT. They see enterprise IT becoming more involved with enterprise BI in order to save on the costs it takes to manage Big Data.
  3. Self-Service BI – We’re seeing it with the addition of Powerview to Excel, the desire for people to be in charge of their own data with less of a reliance on IT support to pull information and make business decisions. Forrester cited: Continue reading 2013 Business Intelligence Trends

Is Microsoft Excel the Next Great Business Intelligence Tool?

Credit: http://www.pbi2.com/images/img_businessIntel.jpgWith Microsoft’s release of Office 2013now fully equipped with features such as PowerPivot and PowerView, news outlets and blogs are abuzz speculating this is a push to make Excel the next Business Intelligence (BI) tool. Software Advice sat down with Rob Collie, CTO of PivotStream and one of the founding engineers of PowerPivot, to get his perspective on how the new Excel will affect Business Intelligence and Excel professionals.

[Read the full interview here.]

Takeaways from the interview:

1. More adoption of PowerPivot in the Excel community. PowerPivot has yet to receive a lot of attention among the Excel audience. 

“Unlike programmers, BI specialists, and other IT pros, the Excel audience doesn’t congregate at conferences and they don’t closely monitor what Microsoft is saying about the next version of their toolset. Overwhelmingly, the way they learn about new Excel capabilities is by inspecting the latest version once it lands on their desktop.”

All of that is about to change now that Office 2013 has more tightly integrated PowerPivot into Excel. Originally a separate download, PowerPivot is now part of the original package upon purchase.

2. The PowerPivot community is growing.

“Using PowerPivotPro traffic as a guide, I’ve seen the PowerPivot audience double in size every year since 2009. But I’d still estimate that less than one percent of the eventual PowerPivot target audience has been exposed to the product as of today.”

3. All Office users now data analysts? Continue reading Is Microsoft Excel the Next Great Business Intelligence Tool?

New in OfficeWriter 8.3: Auto Filters and More!

OfficeWriter 8.3 is filled with exciting new features. Here are some of our favorites:

Auto filters in ExcelApplication

Auto filters are an easy way to view and filter data in a worksheet, and now you can add them programmatically with ExcelApplication in XLSX and XLSM files!

All you need to do is create an area on the worksheet where you want the auto filter to be, then apply the auto filters to that area. This works on data sets that already have data, and data sets that just have ExcelTemplate data markers.

wksht.AutoFilter.Area = wksht.CreateArea("A6:D14");

Remember, you only get one set of auto filters per worksheet, so if you set the auto filter to a new area, you’ll lose your original filters. Continue reading New in OfficeWriter 8.3: Auto Filters and More!

Everything You Need to Know About OfficeWriter: The Whitepaper

Looking for a comprehensive overview of OfficeWriter? You’ve come to the right place. We’ve partnered with Andrew Brust of Blue Badge Insights to give you an inside look at how OfficeWriter can benefit your company’s business intelligence.
OfficeWriter Whitepaper
Microsoft Office and Data: A Love Story
Excel and Word are the Will and Kate of the Office software world, but if you try to use them for data analysis, they’ll morph into Milli-Vanilli. OfficeWriter prevents that from happening.
In this whitepaper, you’ll learn:
  • How OfficeWriter’s API and templates provide bridges between Microsoft Office & databases
  • How OfficeWriter enhances SQL Server Reporting Services
  • How OfficeWriter turns SharePoint lists & libraries into full-fledged Office docs
That is simply the beginning. Get a full overview of OfficeWriter today.

Creating a Sales Pipeline Report with ExcelWriter

One of the great features of ExcelWriter is Grouping and Nesting feature of ExcelTemplate. Grouping and Nesting allows you to easily format your data in order to make it more readable. This feature is especially handy when applied to a common report, such as a sales pipeline report. Internally at SoftArtisans, we use ExcelWriter with Grouping and Nesting when generating our own sales pipeline report! By taking advantage of this feature, you can get fancier looking reports with little additional effort – ExcelWriter does the formatting work for you!

Before we begin, let me say that I will not attempt to tell you how to query your data as I’m sure everyone will be using different CRM systems. However, no matter how you’re querying your data (be it SQL, or a web service like SOAP or REST) the process is generally the same.

To start, you need to decide how you want to group your data. In most cases you’ll want to group first by month or quarter; then you could group by salesperson. These can be whatever you want, but you must have a column in your result set that will represent each.

For example, we group our own sales report data by: Continue reading Creating a Sales Pipeline Report with ExcelWriter

Automating Reports with SSRS Subscriptions

SQL Server Reporting Services subscriptions are an easy way to automatically run and deliver SSRS reports. You can schedule reports to run at a regular interval and deliver to file share, e-mail, or a SharePoint document library (if you’re using SharePoint integration mode).

How it’s done:

Here is my SSRS 2008 R2 instance, with a couple of prepared reports:

I’m going to create a subscription for SSRS_example_multivalue, which has a parameter with multiple values to select from. Continue reading Automating Reports with SSRS Subscriptions

PowerPivot Part 4: Sharing PowerPivot Workbooks

So now you have a PowerPivot workbook that’s far too awesome to keep to yourself. How do you go about sharing PowerPivot workbooks?

You could just distribute the workbook wholesale, but that’s not optimal because any user who wants to take advantage of the PowerPivot features needs to have PowerPivot for Excel 2010 installed on their machine to fully run the report.

Where else can you turn?

Luckily, SharePoint 2010 introduced PowerPivot for SharePoint that is comprised of two main pieces:

  • Server software that can retrieve the data for the report
  • The PowerPivot Gallery

The SharePoint PowerPivot Gallery is a special document library that has document management and preview for PowerPivot workbooks (along with a few other document types). With the PowerPivot Gallery’s live preview, you can interact with a PowerPivot workbook, just as you would in Excel.  You can also create workbooks from published PowerPivot workbooks and schedule data refreshes for added versatility. The gallery also has several customization options for how the reports are listed.

What’s the catch?

Continue reading PowerPivot Part 4: Sharing PowerPivot Workbooks

PowerPivot Part 3: Slicers

Hello everyone, Pitan here! This is the third chapter of my PowerPivot epic. Read the adventure from the beginning with PowerPivot Part 1: Bringing Data Together or continue on to your regularly scheduled programming with slicers!

Okay, so technically slicers aren’t specific to PowerPivot, but they are new to Excel 2010. Chances are if you are working with PowerPivot, you’ll want to know about slicers.

What is a slicer?

A slicer is a visual representation of a filter applied to your PivotTable or PivotChart. Rather than having to use the drop-downs for report filters, column labels, or column rows like this:

You can have an aesthetically pleasing slicer to show you at a glance what data is filtered:

How do slicers work?

Continue reading PowerPivot Part 3: Slicers