Let’s get straight to the point, because frankly who wants to waste any more time finagling your data and reports? The following are the top 5 Excel features I use on a constant basis to get the most out of my data.
For reference, you can download the example workbook I used in this post: Top5ExcelFeatures.xlsx
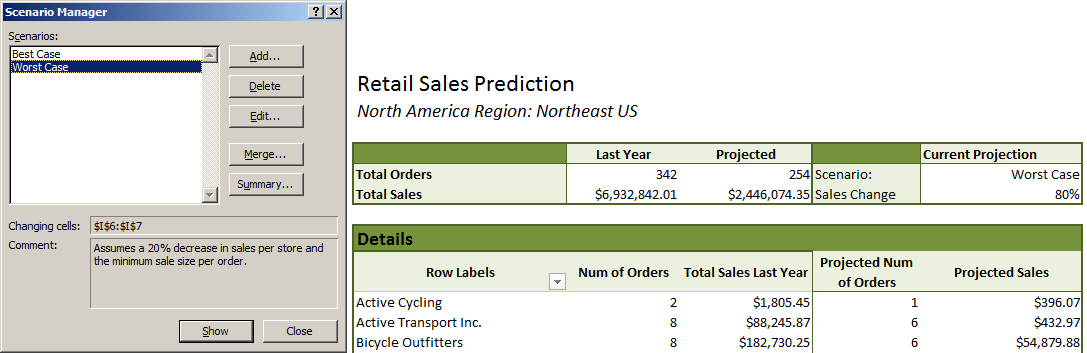
#5 – What-If Analysis
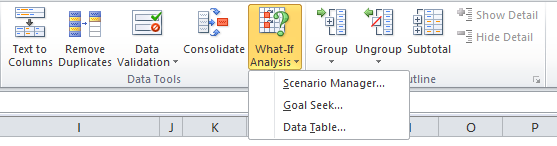
I actually only started using this one recently, but it’s quickly become a favorite. I’m particularly fond of the Scenario Manager function. What-If Analysis is comprised of three pieces: Scenarios, Goal Seek, and Data Tables.
Scenarios has the ability to define a scenario that is associated with a particular set of cell values. You can define new scenarios that are tied to different cell values. When a new scenario is loaded, all of the values update. This is great for flipping between Best Case and Worst Case views of a worksheet.
The other two pieces are Goal Seek and DataTables. In Goal Seek, Excel automatically computes and finds a calculated value based on the value of another cell, such as finding an interest rate based on a monthly payment. Data Tables allows you to hook up entire tables of values based on up to two variables.
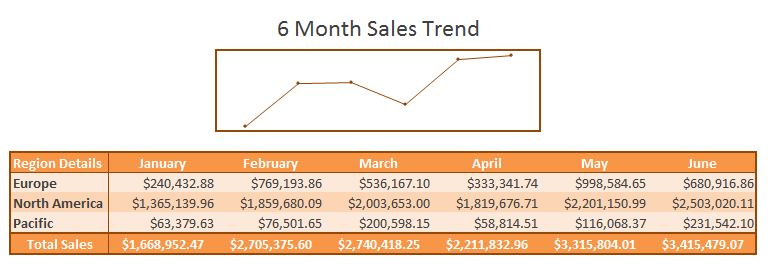
#4 – Sparklines
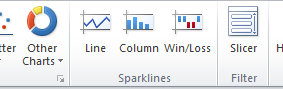
These mini-charts were released in Excel 2010 and they provide a quick way to plot a set of data, rather than deal with the overhead of setting up an entire chart. Excel currently offers three types of Sparklines: Line, Column, and Win/Loss. There are basic color and axis options, including a special option if you have data spread over a series of dates.
#3 – Conditional Formatting
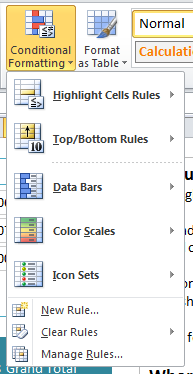
How would I ever live without conditional formatting? You can start as simply as defining cell formatting to apply whenever a custom formula evaluates to TRUE, which is great for identifying low or high numbers in a large table.
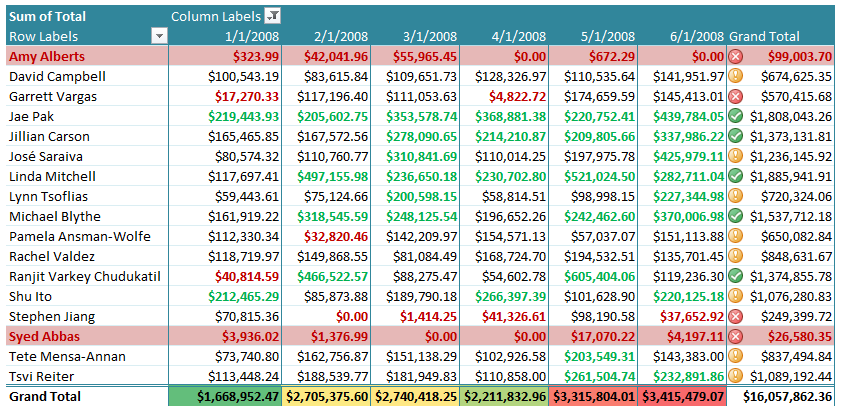
You can also take advantage of the built-in icon sets, data bars, and color scales that were introduced in Excel 2007 and just format based on all the values in a row or column.
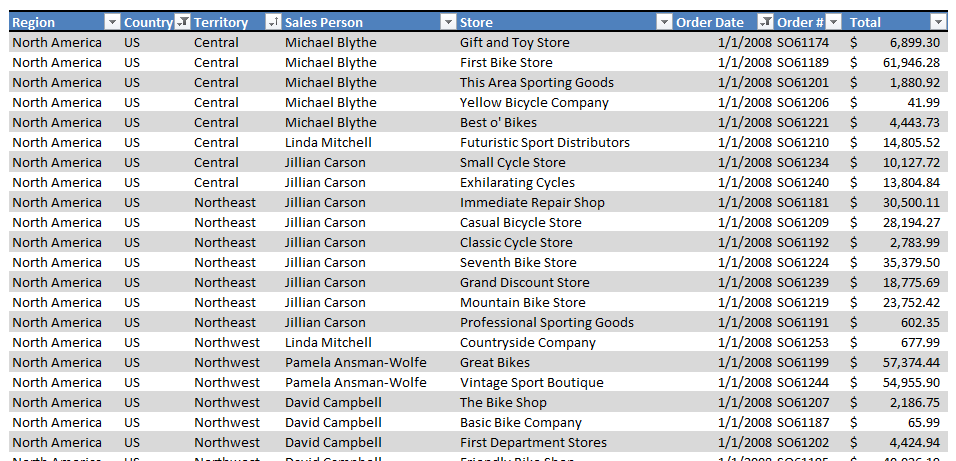
#2 – Format as Table
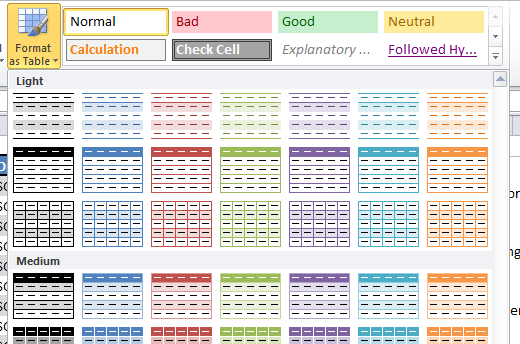
Ever feel like it’s just too much work to get alternating colors on the rows of your data? Wish there was an even easier way to add autofilters? Frustrated with having to type out formulas?
Use Format as Table. Excel will automatically detect your header rows, apply your desired formatting, add auto filters, and then give you a one-click option to add a total row.
And…
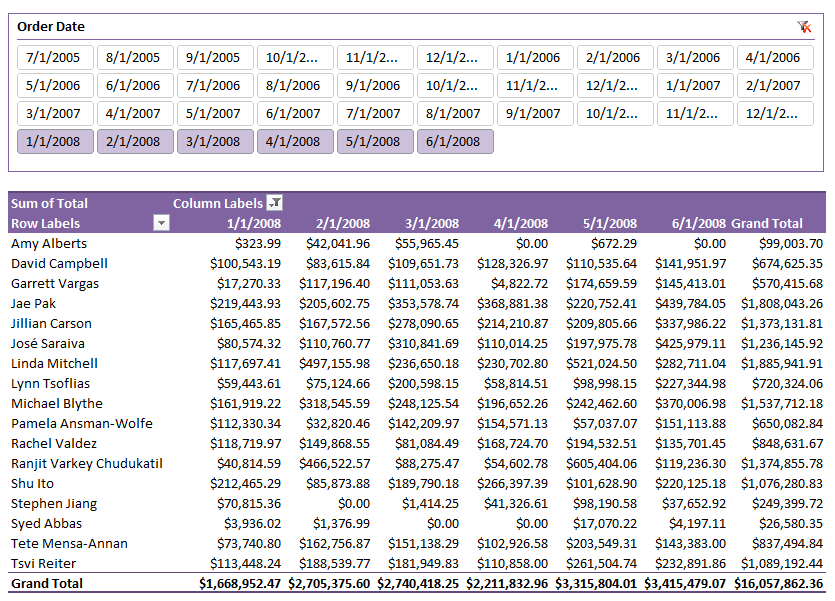
#1 – PivotTables
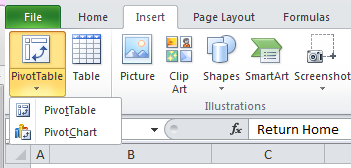
You saw that one coming, right? I still hold thatPivotTables are the most underutilized Excel featureout there and they’ve been around since 2000! No other feature gives you grouping (across rows and columns), sorting, filtering, pivoting, aggregation, and easily applied styles in such little effort.
Want something more visual than a table? Use PivotCharts to display your table’s data or add a slicer for a graphical view of the filters applied.
Additional Reading
To learn more about using these features in your Excel workbooks, see:
- Introduction to what-if analysis
- Format an Excel table
- Use sparklines to show data trends
- Quick start: Apply conditional formatting
- Create or delete a PivotTable or PivotChart report
To see how to use these features with ExcelWriter, check out our documentation, wiki.softartisans.com, or our online community OfficeWriter Answers.
Share the post "5 Underutilized Excel Features To Take Advantage Of"
 Follow