Category Archives: Business Intelligence

PowerPivot Side Quest: How to Format a Slicer

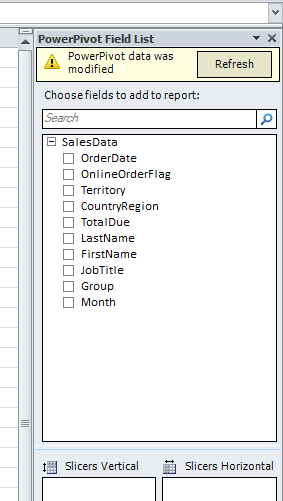
Pitan here! In Part 3 of my PowerPivot blog series, I cover how to add slicers to a PowerPivot report.
This post covers how to format slicers in Excel 2010 – in particular, how to create a custom slicer style that can be applied to multiple slicers.

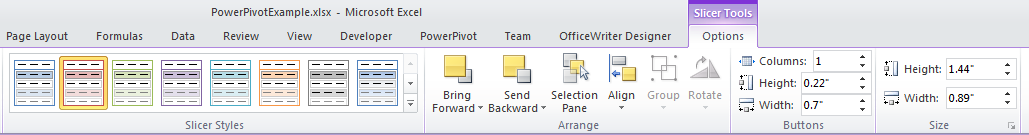
The first step is to select the slicer to activate Slice Tools tab in the ribbon.

There are default styles available, but in this case we want to make a customized slicer style. You can create a new style from scratch:

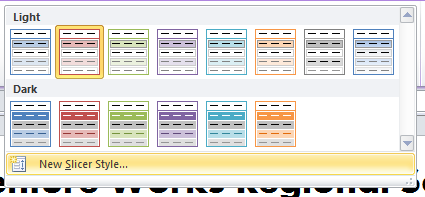
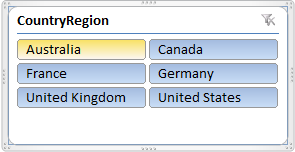
But you may find it easier to clone the style and then modify the style properties, which is what we will do in this example. Here is the slicer with the unmodified clone of the style:

Continue reading PowerPivot Side Quest: How to Format a Slicer

PowerPivot Part 2: Copying PivotTable Functionality

Pitan here! This is Part 2 of my series on PowerPivot, which started with looking at how PowerPivot handles data. This time we’re covering similarities and differences between PowerPivot and regular PivotTables.

PowerPivot offers all the existing functionality of PivotTables with stronger backend support for data sources. Most of PowerPivotTables is exactly the same as regular PivotTables, but there are a few minor differences. So rather than tell you how to create PivotTables with PowerPivot, since you should theroretically be able to reuse your existing PivotTable know-how, I’m going to focus on some of the differences that threw me for a loop.

Refreshing Data

If you’re familiar with PivotTables, then you probably know that if you make changes to the original data for your PivotTable, you have to refresh the PivotTable in order to see those changes take effect.

PowerPivot is no different, except that it’s a bit more explicit. When you refresh the data in PowerPivot for an existing PowerPivotTable, the PowerPivot field dialog will tell you that the PivotTable also needs to be refreshed.

It’s easy to forget that refreshing PowerPivot doesn’t refresh everything, but at least Excel constantly reminds you.
Continue reading PowerPivot Part 2: Copying PivotTable Functionality

PowerPivot Part 1: Bringing Data Together

Hello everyone, Pitan here! I’ve finally had the chance to get my head around PowerPivot, the new Excel 2010 add-in for grabbing, pivoting, and displaying data. The chronicles of my journey to set up my own PowerPivot report will be revealed in a series of blog posts over the coming weeks. Tune in as I give you some HOW-TOs with a healthy dose of side commentary!
Continue reading PowerPivot Part 1: Bringing Data Together

Twitter Roundup: Talking About SSRS

Hello!  Welcome to my first post.  I’m Elise, lover of social media and self-proclaimed coffee addict.  As a newcomer to SoftArtisans, and to the MSFT tech arena in general, I’ve been trying to absorb as much info on the technologies we run on as possible. Since one of OfficeWriter’s main features is its SSRS designer, I decided to tackle this reporting beast first. Luckily, the Twittersphere is rife with helpers. Some of my favorite SSRS-related tweets (and tweeters) are below.  (Click the picture to see the full list.)  If you have any favorite SSRS bloggers, tweeters, or posts I’d love to hear about them!  Send me a tweet or leave a comment in the comments section so I can check it out.

Jason Thomas Reviews OfficeWriter’s SSRS Integration

The following is a review of OfficeWriter written by Jason Thomas, a BI consultant specializing in SSRS.  Read the full review here.

“As a BI consultant specializing in SSRS, I have had lots of frustrations and hard times because of Excel. Every now and then, I have some or other business user coming up to me and asking for some feature which is there in Excel but not in SSRS. If you have been following my blog, you would already know that I am more of a work-around man, trying to find some alternative for features which are not supported out of the box. But when it comes to Excel related features, most of my attempts end in disappointment. So naturally, my ears perked up when I was asked to review a plugin which claimed to build SSRS reports using Excel and Word.

So I downloaded OfficeWriter v8 and spent close to a week playing around with it. Even though I encountered some minor quirks (v8.0 doesn’t run on the 64 bit version of Office 2010 yet – luckily I had a home pc with a 32 bit version of Office; got some minor issues when editing and deploying an existing SSRS report with shared data sources – got around it by setting the data sources once again from the report manager), overall I have been very pleased and of course, excited at the different prospects that this plugin opens up.”

[Click here to read the full review]

Boston’s Big Datascape, Part 3: StreamBase, Attivio, InsightSquared, Paradigm4, Localytics


[Excerpted from the Riparian Data blog]

This ongoing series examines some of the key, exciting players in Boston’s emerging Big Data arena. The companies I’m highlighting differ in growth stages, target markets and revenue models, but converge around their belief that the data is the castle, and their tools the keys. You can read about the first ten companies here and here.

11) StreamBase

  • Products: StreamBase Complex Event Processing Platform lets you build applications for analyzing real-time streaming data alongside historical data. StreamBase LiveView adds an in-memory data warehouse and a BI front-end to the equation, essentially giving you live (well, a few milliseconds behind) BI.
  • Founder: Richard Tibbetts (t |ln), Michael Stonebraker
  • Technologies used: Complex Event Processing, StreamSQL, cloud storage, pattern-matching, in-memory data warehouse, end-user query interface
  • Target Industries: Capital Markets, Intelligence and Security, MMO, Internet and Mobile Commerce, Telecomunications and Networking
  • Location: Lexington, MA

[read the full post at the Riparian Data blog]

Everything You Wanted To Know About Power View—But Were Afraid to Ask

Before you decide whether Power View is the best damn thing to happen to self-service BI since graph paper or is just a smoke and mirrors, CamelCaseless extension to PowerPivot, you need to know its gist. The following blog posts and videos will give you just that, from a (mostly) business user perspective. Read ’em, and then get cracking with the CTP3 version, available for download here.

  • Dan English’s (b | t) “Intro to BI Semantic Model & Delivering Self-Service Reporting with Power View (Crescent)” video and slide deck

A comprehensive MSBI presentation that covers the BI Semantic Model concept, Power View and SQL Server Analysis Services with Power Pivot in SQL Server 2012.

Continue reading Everything You Wanted To Know About Power View—But Were Afraid to Ask

Masterpiece Theatre SharePoint: Power View and Hadoop

In this episode of Masterpiece Theatre: SharePoint, we’re talking Cresent erPower View. Press play to learn why Power View is good for PowerPivot and bad for Tableau, how it transforms big Hadoop data into technophobe-friendly animated reports and what your edition of SharePoint needs to get it up and running.

Related Posts