Truth in Tech Ep. 10: Acquisitions, Drones, & Starbucks Square

Our weekly series, Truth in Tech, is now a podcast! So you can listen at your convenience – at your desk or on-the-go.

1. Acquisitions Galore:

Pinterest Buys LivestarLivestar amalgamates reviews for restaurants, movies, and music from reputable sources such as newspapers, local news blogs, Facebook friends, or people in your contact list. The acquisition cost wasn’t revealed, but Livestar did have some top investors and $2 million in funding

Babbel Startup buys PlaySay: Babbel is a language learning startup. PlaySay is a English/Spanish learning app for the iPhone where you can have real conversations with pronunciation feedback. Again exact amount of buyout not revealed, but Babbel’s goal is to break into the US Market.

2. Google launches Keep on Android and Google Drive: Keep is Google’s version of Evernote that syncs to your Google Drive. It’s android only at the moment, but wired predicts an iOS version soon

3. The Senate Judiciary Committee held a hearing yesterday on the privacy implications of tiny, cheap drones.

“The drones, or unmanned aerial systems, have already helped the police find missing people and county planners measure the growth of a landfill. But they could also be used by drug dealers, pedophiles and nosy neighbors, the witnesses and a senator said.” Currently, only government agencies and police departments can fly drones, but the FAA will have rules in place for commercial use by 2015.

4. Starbucks’ Square Deal

Square may bill itself as the simplest way to pay–but Continue reading Truth in Tech Ep. 10: Acquisitions, Drones, & Starbucks Square

Resources Every Performance Tester Should Know About

Performance is a widely overlooked feature in the development world. In enterprise development, better performance can correlate directly to company profit. More efficient programs utilize fewer resources; fewer resources cost less money.

On the consumer end, performance can make or break a product. One reason Google has such great market share is the speed at which they deliver their applications and data. The philosophy is pretty simple really: when users have to wait for something, they either get distracted (in which case they forget about you) or frustrated (in which case they’re mad at you).

The bottom line is performance matters. That’s why performance testing is vital to any product and company. I’ve outlined a few resources that I’ve found to be the most useful for performance testing below:

1. Steve Souders’ Blog

Steve Souders is the head performance engineer at Google and has literally written THE book on web performance. I’ve been on Steve’s RSS feed Continue reading Resources Every Performance Tester Should Know About

March Madness: Predict Your NCAA Basketball Brackets with Excel

Every year in March, the NCAA hosts the college Men’s Basketball Tournament. Every year, I go through all of the teams, create my brackets, and see if I can do better than my friends. My one downfall is I always have my favorites: you know, the teams you follow because you went to school there, the team your significant other cheers for, your alma mater’s arch-nemesis, or the team with that really cool mascot. Whatever the reason, the biases end up costing you the first round, sidelining you out of the pool. What we need is a simple way to generate our bracket and remove some of that bias.

Instead of using a totally random outcome, let’s use a few of Excel’s analytical features to increase our chances of putting together a winning bracket. Let’s take Mens NCAA Basketball tournament data since 1985 (courtesy of The Washington Post‘s database), that has the history for specific seeds, teams, coaches and conferences – everything from each school’s tournament results to how No. 7 seeds have fared against No. 10 seeds in the first round. Using this data as a starting point allows us to inject reality into our random numbers. Because really, it is not ever worth considering if a 16 can beat a 1, right?

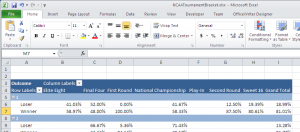
After copying and pasting the data from the webpage into an Excel spreadsheet, it’s time to input the formulas. It’s basically a two-step process. What we need to calculate is the probability of a particular seed winning or losing. If you hadn’t seen it before, a 9 seed beets an 8 seed more often than not, and a 1 seed has never lost. The pivot table I created reflects that, proving to be a useful tool in our selection process. It’s not too difficult to create a pivot table by seed and win/loss and by round for our source data. (See the workbook attached at the end of this post.)

First Pivot Table

Next, we develop a formula that uses the probabilities along with the RAND() function to predict the outcome of a match-up. All we need to do is apply the random number to the pivot table data to determine which of the two seeds advance to the next round. There is no easy way to do this, except with a long and complicated formula. Luckily, most of the formula is calculated by Excel by doing a simple click. The two Excel functions that get this done for us are the RAND() and the GETPIVOTDATA(). RAND() is well documented, but the GETPIVOTDATA() allows us to treat the pivot data like a database to get our probability for a seed to win the match-up.
Bracket

After playing with the output for a few runs, I noticed that the later rounds are fully dominated by the higher seeds. That happens because of the limited data for lower seeds in the later rounds. I want to allow for those Special Case teams to triumph over the Big League teams, so I added Continue reading March Madness: Predict Your NCAA Basketball Brackets with Excel

2013 Business Intelligence Trends

Credit: e-bcorp.com

A few weeks ago we posed the question of whether or not Excel had the staying power to be the next great Business Intelligence tool. An overwhelming percentage of readers said yes. This week we decided to delve further into what else is on the horizon for the Business Intelligence arena.

Each year experts and industry leaders make their predictions on what lies ahead on the Business Intelligence landscape. We’ve distilled those predictions down to ones that appeared several times over. Looking at TechTarget, InformationWeek, Forrester, and Tableau Software, we scoped out the top Business Intelligence (BI) trends for 2013 and this is what we discovered.

  1. Cloud BI – The cloud isn’t going anywhere. It still has a lot of attention, despite the reliability, performance, availability, and privacy concerns from your IT department. The cloud’s ability to adjust to larger and larger data sets and petabytes of information makes it attractive for the Business Intelligence arena. TechTarget doubts moving infrastructure to the cloud will become mainstream in 2013, but that it is definitely destined and headed in that direction.
  2. Big Data – Big Data still gets big talk. Forrester predicts a rise in Hadoop-based BI applications, particularly within the mission-critical applications. Along those same lines, Forrester sees Big Data moving out of silos and into enterprise IT. They see enterprise IT becoming more involved with enterprise BI in order to save on the costs it takes to manage Big Data.
  3. Self-Service BI – We’re seeing it with the addition of Powerview to Excel, the desire for people to be in charge of their own data with less of a reliance on IT support to pull information and make business decisions. Forrester cited: Continue reading 2013 Business Intelligence Trends

My Beef with Tech Acronyms

Acronyms
Credit: itspchan.files.wordpress.com

With mouthfuls like Application Service Providers and SQL Server Reporting Services (thank you, Microsoft) floating around the tech blogosphere, it’s no wonder why we want to shorten these phrases. We just want to try to make our lives a little easier, save a few precious moments, increase our productivity. But are we really making it easier to understand or just muddying the waters?

Here’s my beef with acronyms. I don’t like them. If I could avoid acronyms at all costs, I would. Why the disdain, you ask? Why pick up the battle cry and lead the charge against these meant-to-be-helpful shorteners? Simple. Because they’re not helpful. They’re downright confusing.

  1. You have multiple groups using different phrases for the same acronym. And most of the time people using these acronyms provide no context, no frame of reference for what they’re talking about. They just throw in the acronym in to the abyss hoping it sticks.
  2. It takes time to decipher these meanings. The time and energy it takes to figure out what in the world people are trying to communicate voids any time you saved tweeting, posting, texting the message because your audience did not get it, or it took several more texts, tweets, and posts to hash(tag) out the exact meaning.

Here’s a fun test. What do the following acronyms stand for?

SQL, SaaS, MIS

Did you answer Structured Query Language, Software as a Service, and Management Information System? Well, you would be correct. But if you answered Sender Que Low, Storage as a Service, and Mobile information Server you would also be correct.

Shane O’Neill from CIO investigated 10 New Ridiculous Tech Acronyms, letting me know I’m not the only one with these frustrations. Not surprisingly, enterprise software companies were the biggest offenders. Among the listed ridiculous acronyms Continue reading My Beef with Tech Acronyms

[Webinar] Making Reporting Easier with SSRS Designer Ribbon

SSRS Webinar

With data sets tied to different data sources and multiple people handling one report, the process of building a report can get messy. OfficeWriter’s built-in Designer Ribbon makes it easier to interact with SQL Server Reporting Services (SSRS), helping you access reports from your applications on time and with ease. Join us Friday, March 22nd as our Senior Sales Engineer, Chad Evans, shows you how this feature makes using SSRS simpler.

In this webinar you will learn:

  • How to build an SSRS report from start to finish using the OfficeWriter designer ribbon
  • How to easily open existing reports, create new ones, and view reports in process with SSRS

We will also have a question and answer period at the end of the webinar. Feel free to send in questions prior to the webinar so that we can include them in the presentation.

When: Friday, March 22nd at 1 P.M. EST

Can’t attend, but still want a copy of the recording and slides? Register below and we’ll email it out following the webinar.

**Spots are limited. So please register early to secure your seat.


Staff Picks: Apps to Use, News to Read on the Commute

Credit: tjba.comOnce a week I snoop around the office, bothering my coworkers with questions on what they’re reading, listening to, consuming, or any other random inquiries I’d like to subject them to. Sometimes they even respond.
The questions:
 1. What did you read this week?
2. What is the latest app you are all excited about?
 
The answers:

David, CEO of Riparian Data

1. Reality is Broken

2. We’ve used GroupMe pretty extensively this week at SXSW and it has worked out well. GroupMe is a free group messaging app for your mobile device.

Christina, User Experience Designer

1. Would you buy Gucci off your Smartphone?

2. Little Inferno has been fun over the weekend. It takes about 15min of play before getting into the story line though.

Ozgur, Software Engineer
1. I read this article on Mysterious Bacterium Found in Antarctic Lake. Although, I just saw this blog post that disputed it, saying there was not actually a new bacteria. So now I don’t know what to believe.
2. Although it is not an “app,” I have been looking into the functional programming language F#.

Kristen, Sales Rep

  1. Florida Anglers Liven up Spring Break by Reeling Sharks onto the Beach
  2. Poshmark. It’s like ebay for clothes, but much easier.

Annie, Executive Account Manager

1. What Most School’s Don’t Teach by Code.org

2. Seconds – interval timer/training


Nick, IT Admin Continue reading Staff Picks: Apps to Use, News to Read on the Commute

Big Data and OfficeWriter

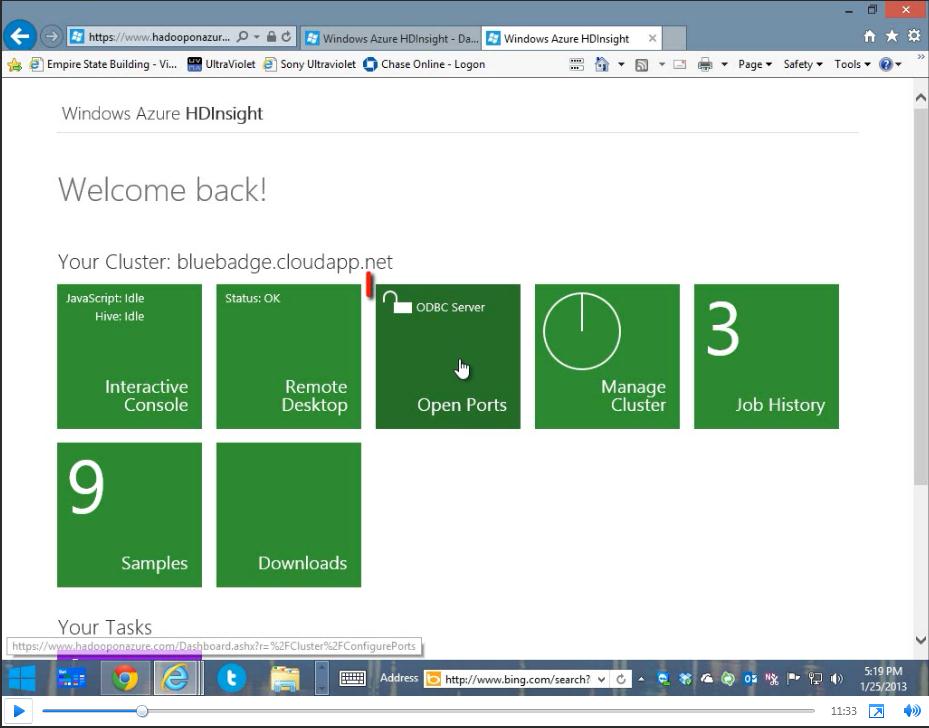
Big Data DemosWe partnered with Andrew Brust from Blue Badge Insights to integrate OfficeWriter with Hadoop and Big Data. Taking existing OfficeWriter sample projects, Andrew discusses how he created two demos showing OfficeWriter’s capabilities to work with Big Data. One demo uses C#-based MapReduce code to perform text-mining of Word docs. The other demo focuses on connecting to Hadoop through Hive.
In these demos you will learn:

  • How OfficeWriter integrates with Hadoop and Big Data
  • How to use ExcelWriter with Hadoop


Windows Azure and OfficeWriter

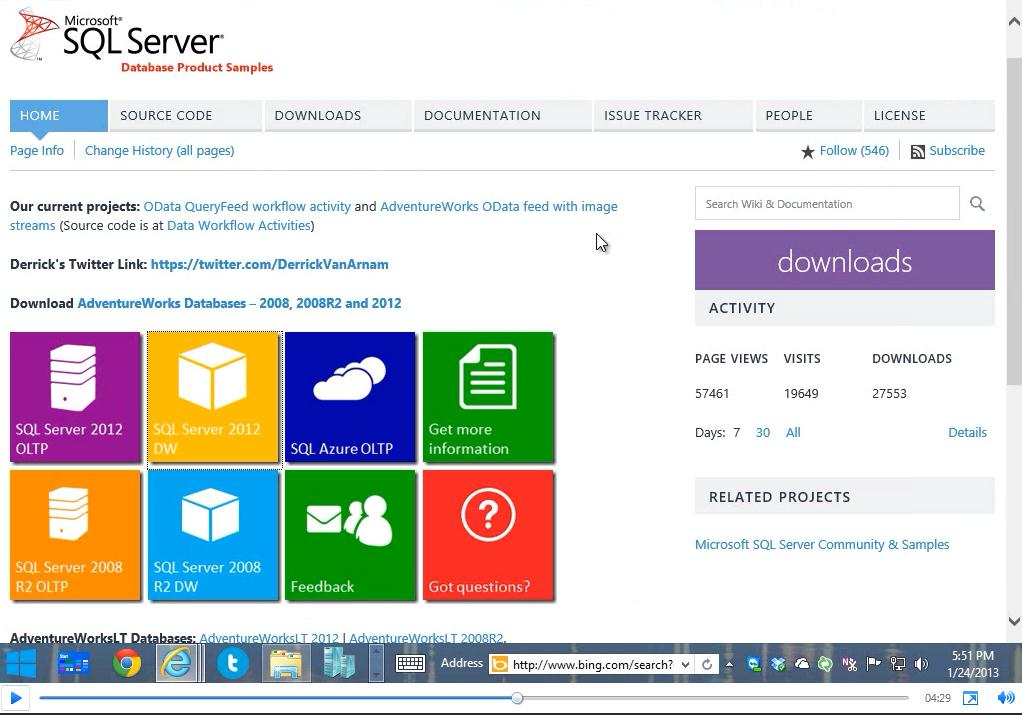
Windows Azure and OfficeWriterWe’re taking OfficeWriter to the cloud. In these videos you’ll see how OfficeWriter runs on Windows Azure. Taking our exisiting OfficeWriter web sample projects, Andrew Brust from Blue Badge Insights made them run on the Windows Azure cloud platform.

In these videos you will:

  • Learn how OfficeWriter web samples were put on the cloud
  • Learn how the runtime environment for the Windows Azure samples compares to the ASP.NET samples
  • Have access to the OfficeWriter web samples


The Robots Can Have the World, Just Let Me Keep Drinking in It (a SXSW Countdown of sorts)

Headed to SXSW this year? Well, you’re in good company. So is our partner company Riparian Data. Not only are they unveiling their new email app, Gander, they’re on a mission to synthesize the latest and greatest innovations and A-list after parties in one pithy newsletter. Check it out here and get a SXSW preview below.
sxswi parties

​Image via FEED

Author: Claire

At standup today (cuz we scrummy like that), Christina said that one of the things she needed to do was to sign up for SxStuff.

To which I said, in my head and on this here blog, “bout dang time, girl.”

To which she said, in real life, “but there is just so much stuff—it’s overwhelming.”

As the type of person who eschews the Bloomingdales and Barney’s Warehouse sales for shoebox boutiques selling three variations of sailor shirts, I feel her pain. Sooo, I went and compiled a list of Stuff You Ought Not Miss. A couple lists, actually—one for our newsletter (sign up here!) and one for the blog. The latter is more of a potpourri, but it’s a kicky one, je vous promis.

Non-perMissable sessions:

1. Open-source Empathy: Humans as Dynamic Systems

  • By: Daniel Buckley (b t)
  • Why: It’s about our resistance to interpersonal connection, through the lens of media system interaction. I think.

2. Creating a DIY API: Open Source for Makers

  • By: Kate Covington (t)
  • Why: Open source fashion sounds like an awesome way to stick it to a) LVHM and b) counterfitters. Why buy fake when you can make?

3. Hacking Cities for a Better, Sustainable Tomorrow

By: Abhi Nemani (b t), Bryan Walsh (b t), Erika Diamond (in), Rachel Haot (t)

Why: Community-driven digital and technological engagement is a cheap and effective way to improve cities, and learning about some of the civic-improvement apps from some seriously smart, keyed-in citizenry seems like a good way to kickstart innovation in your community.

4) Is There an Alternative to Ad-Supported Social Networking?

  • By: Dalton Caldwell (b t)
  • Why: Last year, Caldwell published a critique of ad-supported social networking, and proposed a subscription-based, ad-free solution. Then he built it. While I have to confess I haven’t managed to make App.net part of my daily routine (unlike Quibb), I’m eager to hear what Dalton has to say about it.

5) Industrial Revolution 3.0 and the Future of 3D Printing

  • By: Mike Senese (b t) and Peter Weigmarshausen (b t)
  • Why: If 3D printers really are the harbinger of the next industrial revolution, I want to know more about them and they impact they’ll have, and if I should like, take a hardware engineering class or something. And who better to tell me than Wired’s senior editor and Shapeways’ CEO?

Girrrl, you don’t go to Sx for the sessions, you say. Fiiinnne, you want parties? Here are some of the best (and booziest).

Non-perMissable parties:​ Continue reading The Robots Can Have the World, Just Let Me Keep Drinking in It (a SXSW Countdown of sorts)

Blogged