Category Archives: Excel

PivotTables Now Available within OfficeWriter 8.4

OfficeWriter 8.4

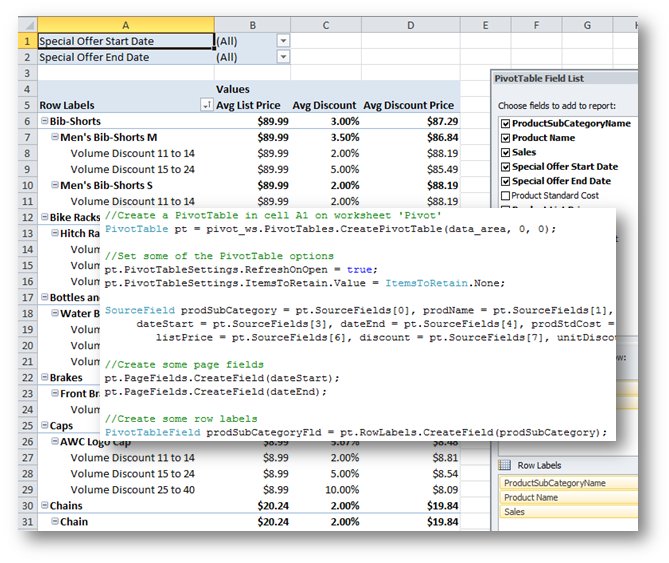
WATERTOWN, MA (February 12, 2013) – SoftArtisans announced the addition of PivotTables to their OfficeWriter product today. OfficeWriter 8.4 is now available for download. Included in this new version, is the ability to create, modify, and remove PivotTables within users’ Excel workbooks. With the new PivotTable functionality customers have the ability to add Report Filters to better filter and sort their data, as well as change the data source of a PivotTable (including PivotTables already copied with CopySheet). This provides users with more fine-grained control over their data and reports.

Also included in this product release are new features to their WordTemplate model. Within WordTemplate DOCX files, users now have the option to programmatically set the document properties of their DOCX files and to remove bookmarked content when delivering reports.

OfficeWriter provides customers Continue reading PivotTables Now Available within OfficeWriter 8.4

What’s new in OfficeWriter 8.4

PIVOT TABLES ARE HERE!

OfficeWriter 8.4 packs a powerful punch with exciting new features, most notable of which is ExcelApplication support for PivotTables in OOXML (XLSX, XLSM) files. ExcelWriter already supports the use of PivotTables in ExcelTemplate and SSRS reports,  but now you can programmatically create, manipulate, and remove PivotTables with ExcelApplication.

BlogPostPivot

The new PivotTable API gives you the freedom to:

  • Create PivotTables from scratch (see our tutorial on Creating a Basic PivotTable)
  • Add and manipulate PivotTable fields – data value fields, column labels, row labels, and report filter page fields
  • Access common settings like empty/error values, refresh data when opening a file, and the number of cached items to retain

With the API you also have the ability to change the data source of a PivotTable. Continue reading What’s new in OfficeWriter 8.4

Is Microsoft Excel the Next Great Business Intelligence Tool?

Credit: http://www.pbi2.com/images/img_businessIntel.jpgWith Microsoft’s release of Office 2013now fully equipped with features such as PowerPivot and PowerView, news outlets and blogs are abuzz speculating this is a push to make Excel the next Business Intelligence (BI) tool. Software Advice sat down with Rob Collie, CTO of PivotStream and one of the founding engineers of PowerPivot, to get his perspective on how the new Excel will affect Business Intelligence and Excel professionals.

[Read the full interview here.]

Takeaways from the interview:

1. More adoption of PowerPivot in the Excel community. PowerPivot has yet to receive a lot of attention among the Excel audience. 

“Unlike programmers, BI specialists, and other IT pros, the Excel audience doesn’t congregate at conferences and they don’t closely monitor what Microsoft is saying about the next version of their toolset. Overwhelmingly, the way they learn about new Excel capabilities is by inspecting the latest version once it lands on their desktop.”

All of that is about to change now that Office 2013 has more tightly integrated PowerPivot into Excel. Originally a separate download, PowerPivot is now part of the original package upon purchase.

2. The PowerPivot community is growing.

“Using PowerPivotPro traffic as a guide, I’ve seen the PowerPivot audience double in size every year since 2009. But I’d still estimate that less than one percent of the eventual PowerPivot target audience has been exposed to the product as of today.”

3. All Office users now data analysts? Continue reading Is Microsoft Excel the Next Great Business Intelligence Tool?

Cookie Wars Participant: Alison

On the heels of the successful pumpkin pie extravaganza, 12 brave volunteers will present their finest at a banquet in one week. Before the banquet, we’re holding the Cookie War Challenge: where all of the participants will use technology (bonus points and automatic win if they incorporate the technologies used to power OfficeWriter) to represent their cookie, recipe, or baking process. For example, code your recipe in Chef.

As the cookie contest organizer, I decided to kick it off and use Excel VBA and conditional formatting to represent my entry (Peanut Butter Cookies).

How I did it: I made a macro that updates the timer; then layered conditional formats Continue reading Cookie Wars Participant: Alison

NEW OfficeWriter ASKs Forum

You have opinions and we want to hear them. That’s why we’ve created OfficeWriter Asks, a new forum where you can post all of your feedback and wishlist items. Our aim: to bring you the features you desire. Each week we’ll pose a new question related to our OfficeWriter product and how we can improve upon the features you use and need.

This week on OfficeWriter Asks:
  • Pivot Tables
    Love them? Hate them? How do you use them? 


How to Fix Those Pesky Number Formats on Excel Charts

You’ve just finished putting together the best sales report ever, but you realize that the value axis is sporting 9 digits of data instead of the cleaned up version of $1M, $2M, etc…

All I wanted to do was to show $1M instead of $1,000,000.00. Was that too much to ask for?? Is there any hope for getting the value axis formatted properly in this forsaken world of despair?!

Yes. Do not despair. It’s pretty easy, actually.

Start by right-clicking on the value axis Continue reading How to Fix Those Pesky Number Formats on Excel Charts

Everything You Need to Know About OfficeWriter: The Whitepaper

Looking for a comprehensive overview of OfficeWriter? You’ve come to the right place. We’ve partnered with Andrew Brust of Blue Badge Insights to give you an inside look at how OfficeWriter can benefit your company’s business intelligence.
OfficeWriter Whitepaper
Microsoft Office and Data: A Love Story
Excel and Word are the Will and Kate of the Office software world, but if you try to use them for data analysis, they’ll morph into Milli-Vanilli. OfficeWriter prevents that from happening.
In this whitepaper, you’ll learn:
  • How OfficeWriter’s API and templates provide bridges between Microsoft Office & databases
  • How OfficeWriter enhances SQL Server Reporting Services
  • How OfficeWriter turns SharePoint lists & libraries into full-fledged Office docs
That is simply the beginning. Get a full overview of OfficeWriter today.

Outlining Excel Reports with ExcelWriter

Outlines in Excel are a useful way to organize and present lots of data in workbooks.  ExcelWriter offers several different ways to integrate outlines into Excel reports:

ExcelWriter’s Application object (available in Enterprise Edition), provides full control to modify Excel files programmatically. This includes adding or removing Excel outlines and more:

  1. Group an area of rows or columns
  2. Read or set the level of outlining for any given row or column in a worksheet
  3. Read or set whether the group that a given row or column belongs to is expanded or collapsed
  4. Ungroup all the rows or columns in an area of a worksheet
  5. Detect where the summary rows or columns are located for all the groups in a worksheet
Sample output from ExcelApplication

Continue reading Outlining Excel Reports with ExcelWriter

Creating a Sales Pipeline Report with ExcelWriter

One of the great features of ExcelWriter is Grouping and Nesting feature of ExcelTemplate. Grouping and Nesting allows you to easily format your data in order to make it more readable. This feature is especially handy when applied to a common report, such as a sales pipeline report. Internally at SoftArtisans, we use ExcelWriter with Grouping and Nesting when generating our own sales pipeline report! By taking advantage of this feature, you can get fancier looking reports with little additional effort – ExcelWriter does the formatting work for you!

Before we begin, let me say that I will not attempt to tell you how to query your data as I’m sure everyone will be using different CRM systems. However, no matter how you’re querying your data (be it SQL, or a web service like SOAP or REST) the process is generally the same.

To start, you need to decide how you want to group your data. In most cases you’ll want to group first by month or quarter; then you could group by salesperson. These can be whatever you want, but you must have a column in your result set that will represent each.

For example, we group our own sales report data by: Continue reading Creating a Sales Pipeline Report with ExcelWriter