Tag Archives: excel charts

Excel Charts Don’t Follow “Move and Size with Cells” Option

Problem

Excel’s “Move and Size with Cells” option allows you to automatically re-size charts if the cells that contain the chart are added or re-sized.

With ExcelWriter, when the “Move and Size with Cells” option is selected in Excel, charts are not re-sized based on rows that are added from data being imported into data markers using the ExcelTemplate object (or OfficeWriter’s SSRS integration). Charts are re-sized if rows are added explicitly using Worksheet.InsertRow.

Example 

The pictures below show a file that has “Move and Size with Cells” option selected, before and after it has been processed by ExcelWriter.
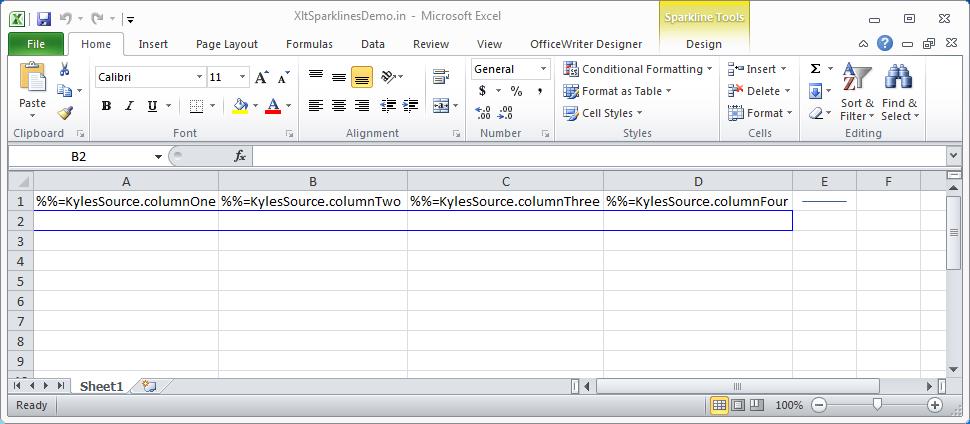
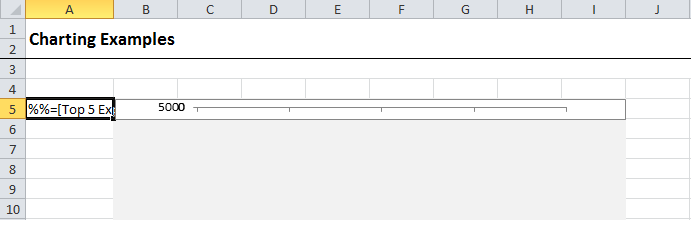
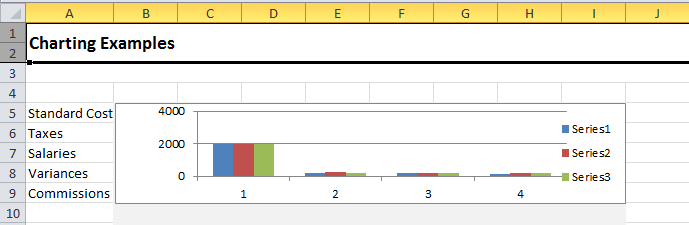
Template

KB_ChartExample1

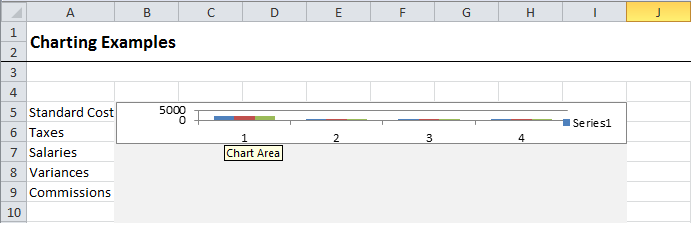
Incorrect output – Note that the chart remained the same size as before the data was imported.

ExcelWriter Chart

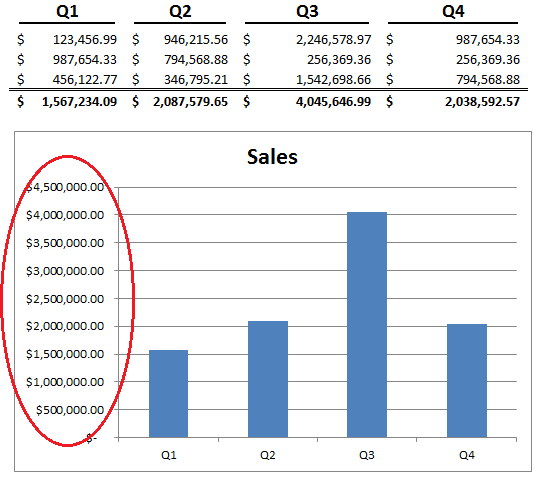
The correct output should look like the following:

ExcelWriter Chart Continue reading Excel Charts Don’t Follow “Move and Size with Cells” Option

How to Fix Those Pesky Number Formats on Excel Charts

You’ve just finished putting together the best sales report ever, but you realize that the value axis is sporting 9 digits of data instead of the cleaned up version of $1M, $2M, etc…

All I wanted to do was to show $1M instead of $1,000,000.00. Was that too much to ask for?? Is there any hope for getting the value axis formatted properly in this forsaken world of despair?!

Yes. Do not despair. It’s pretty easy, actually.

Start by right-clicking on the value axis Continue reading How to Fix Those Pesky Number Formats on Excel Charts

How to make the pie chart display larger

Problem

There is a known issue with pie charts that are created with ExcelApplication in the binary XLS file format. Pie chart display was improved in ExcelWriter 8 for the XLSX file format as part of the ExcelApplication OOXML implementation.

This post addresses how to improve the size of a pie chart in an XLS file.

Solution

There are two approaches for increasing the size of a pie chart:

Approach Before After
Increase the size of the chart while maintaining the proportions between the pie graphic and the chart frame. This requires making the chart (as a whole) larger.
Increase the size of the chart in relation to the chart frame. This requires making adjustments to the chart’s plot area.

Option 1: Increase the pie chart and maintain current proportions

If the pie chart graphic displays too small, increase the chart’s area by providing more room for it in Add method of the Charts object. The size of the pie graphic in the chart is directly related to the amount of space provided for the chart.

To provide more area for the chart, after adding the chart with the AddChart method:

  1. Make the chart wider by increasing the Chart.Width property
  2. Make the chart taller by increasing the Chart.Height property

Option 2: Change the proportion of the chart size in relation to the chart frame

Use the PlotArea‘s Height and Width properties. The values you can provide range from 1 to 4000. 4000 makes the chart take up the maximum area possible. In many cases, this value will be too large. For the area provided in the above code, 2500 is a good value for the PlotArea Width and height.

Trendline Label doesn’t show Equation/R-squared value

Problem

It is possible, in Excel, to add a label to a trendline of a chart that shows the Equation or the R-squared value of the trendline like in the image below:

Trendlines can also be created as objects in ExcelApplication through the Series of a Chart. The Trendline object has the properties to ShowEquation and ShowRSquaredValue.

Setting these properties to true does not seem to have any effect and the label is not shown. However, if you open, with ExcelApplication, an existing workbook which already has a Trendline label these properties will work properly. From that point on you can programmatically change the label as you like using the properties.

Solution

This issue has been resolved for charts in the OOXML file format (XLSX, XLSM) as part of implementing OOXML support for ExcelApplication in OfficeWriter v8.0.

This issue persists for the BIFF (XLS) file format. It can be worked around in the following manner:

1. Create a new chart in Excel and add a trendline.

2. Add the Equation or the R-Square: Select the trendline then right-click the trendline or choose Format>Selected Trendline from the menu.

3. Now simply open the workbook with ExcelApplication.Open, retrieve the trendline and program it any way you like (Including changing the trendline regression type or value or show/hide the Equation or R-Squared value):

Trendline trend = oSeries.Trendlines[0]; //now this will work trend.ShowEquation = true;