 Analyzing and presenting your data is a daunting task. OfficeWriter makes it easier. Next week, we’re making it easier still with a new webinar on data visualization. Joining us is special guest Marc Smith, creator of NodeXL.
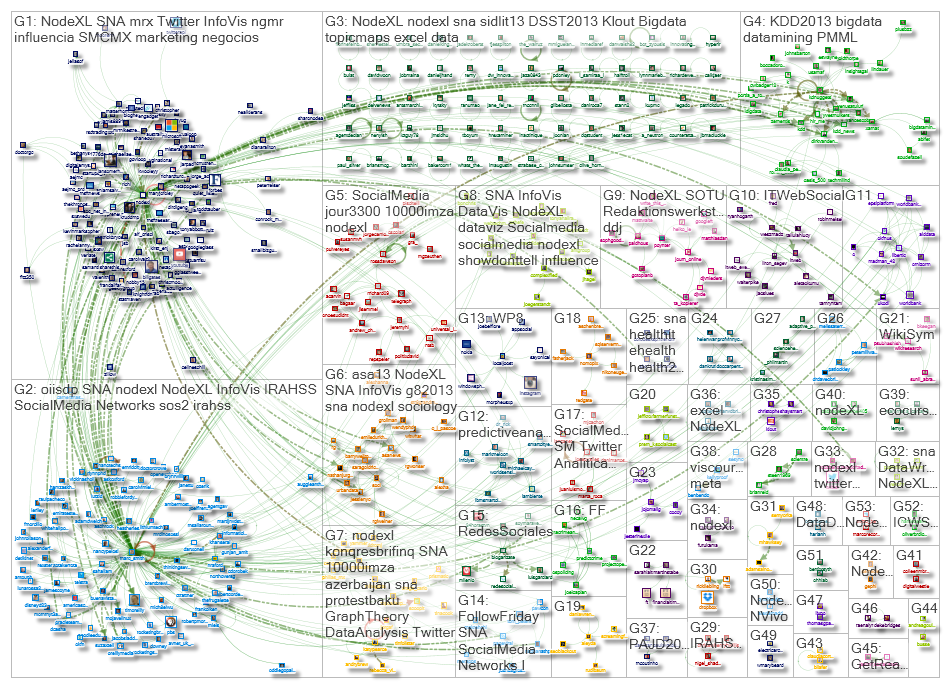
Marc Smith is the Chief Social Scientist at Connected Action Consulting group. Prior to that he worked at Microsoft Research, where he created NodeXL, an Excel add-in, which allows you to import and visualize your social network data, anything from email to Twitter to Flickr and beyond.
In this webinar you will learn:
- The origins of NodeXL and what it could mean for businesses in regards to social networks
- How to find the connections and patterns within your social network communities
- How to use NodeXL to graph the connections between trending Twitter conversations
Q&A with Marc Smith
Leave with new ideas on graphically representing your data, and see how social can impact your business.
When: September 11, 2013 at 1 P.M. EST/10 A.M. PST
*Register early as seating is limited. Can’t attend? Register anyway and we’ll send a copy of the slides and recording following the webinar. Just be sure to write “Request for slides” in the notes section, so we have an accurate head count. Thank you!
