SUMIF and PivotTables can both summarize data based on specific criteria, but they do so in completely different ways. In most cases, PivotTables are going to be faster and easier to get the data that you want, but sometimes using Excel formulas is the only way to handle complicated data.
All the examples from this blog post can be found in this workbook: SUMIF_PivotTable
WHY PIVOT TABLES ARE BETTER
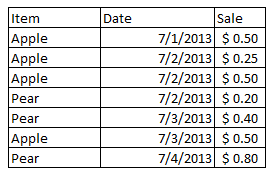
Let’s take a look at a quick example of some fruit sales data, where we want to find information like: all sales for a date, total sales for a fruit in the given time period, or total sales for a type of fruit on a given day.
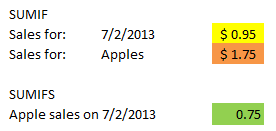
With SUMIF, you can specify the range of values you are using as the criteria (dates or fruit), the values you want to sum (sales), and the actual criteria that will determine if the values are included in the sum (“7/2/2013”, “Apple”). SUMIFS (new in Excel 2007) extends this functionality to allow multiple criteria (dates and fruit):
Note: Excel also offers COUNTIF, COUNTIFS, AVERAGEIF and AVERAGEIFS starting in Excel 2007.
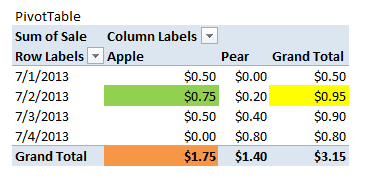
You can do the same with PivotTables, but the PivotTable will also handle sorting, grouping and organizing your data so you can just lift the aggregated values right out from the table:
Here the values are automatically generated by the PivotTable. No extra work needed aside from creating the PivotTable, which is as easy as selecting the data range and specifying where the table needs to go.
Excel also applies PivotTable styles, which change be switched in one click and you can even create your own custom styles.
WHY WOULDN’T YOU USE PIVOT TABLES?
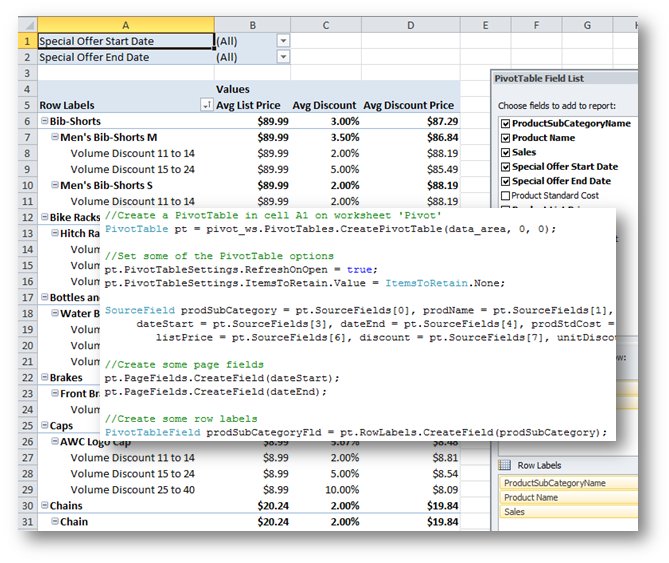
I extended my fruit example to use sample data from the AdventureWorks database, where I wanted to compare online and retail sales for North America, broken down by quarter: Continue reading When to use SUMIF vs. Pivot Tables in Excel
