Tag Archives: powerpivot

Is Microsoft Excel the Next Great Business Intelligence Tool?

Credit: http://www.pbi2.com/images/img_businessIntel.jpgWith Microsoft’s release of Office 2013now fully equipped with features such as PowerPivot and PowerView, news outlets and blogs are abuzz speculating this is a push to make Excel the next Business Intelligence (BI) tool. Software Advice sat down with Rob Collie, CTO of PivotStream and one of the founding engineers of PowerPivot, to get his perspective on how the new Excel will affect Business Intelligence and Excel professionals.

[Read the full interview here.]

Takeaways from the interview:

1. More adoption of PowerPivot in the Excel community. PowerPivot has yet to receive a lot of attention among the Excel audience. 

“Unlike programmers, BI specialists, and other IT pros, the Excel audience doesn’t congregate at conferences and they don’t closely monitor what Microsoft is saying about the next version of their toolset. Overwhelmingly, the way they learn about new Excel capabilities is by inspecting the latest version once it lands on their desktop.”

All of that is about to change now that Office 2013 has more tightly integrated PowerPivot into Excel. Originally a separate download, PowerPivot is now part of the original package upon purchase.

2. The PowerPivot community is growing.

“Using PowerPivotPro traffic as a guide, I’ve seen the PowerPivot audience double in size every year since 2009. But I’d still estimate that less than one percent of the eventual PowerPivot target audience has been exposed to the product as of today.”

3. All Office users now data analysts? Continue reading Is Microsoft Excel the Next Great Business Intelligence Tool?

NEW OfficeWriter ASKs Forum

You have opinions and we want to hear them. That’s why we’ve created OfficeWriter Asks, a new forum where you can post all of your feedback and wishlist items. Our aim: to bring you the features you desire. Each week we’ll pose a new question related to our OfficeWriter product and how we can improve upon the features you use and need.

This week on OfficeWriter Asks:
  • Pivot Tables
    Love them? Hate them? How do you use them? 


PowerPivot Part 4: Sharing PowerPivot Workbooks

So now you have a PowerPivot workbook that’s far too awesome to keep to yourself. How do you go about sharing PowerPivot workbooks?

You could just distribute the workbook wholesale, but that’s not optimal because any user who wants to take advantage of the PowerPivot features needs to have PowerPivot for Excel 2010 installed on their machine to fully run the report.

Where else can you turn?

Luckily, SharePoint 2010 introduced PowerPivot for SharePoint that is comprised of two main pieces:

  • Server software that can retrieve the data for the report
  • The PowerPivot Gallery

The SharePoint PowerPivot Gallery is a special document library that has document management and preview for PowerPivot workbooks (along with a few other document types). With the PowerPivot Gallery’s live preview, you can interact with a PowerPivot workbook, just as you would in Excel.  You can also create workbooks from published PowerPivot workbooks and schedule data refreshes for added versatility. The gallery also has several customization options for how the reports are listed.

What’s the catch?

Continue reading PowerPivot Part 4: Sharing PowerPivot Workbooks

PowerPivot Part 3: Slicers

Hello everyone, Pitan here! This is the third chapter of my PowerPivot epic. Read the adventure from the beginning with PowerPivot Part 1: Bringing Data Together or continue on to your regularly scheduled programming with slicers!

Okay, so technically slicers aren’t specific to PowerPivot, but they are new to Excel 2010. Chances are if you are working with PowerPivot, you’ll want to know about slicers.

What is a slicer?

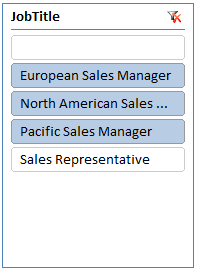
A slicer is a visual representation of a filter applied to your PivotTable or PivotChart. Rather than having to use the drop-downs for report filters, column labels, or column rows like this:

You can have an aesthetically pleasing slicer to show you at a glance what data is filtered:

How do slicers work?

Continue reading PowerPivot Part 3: Slicers

PowerPivot Side Quest: How to Format a Slicer

Pitan here! In Part 3 of my PowerPivot blog series, I cover how to add slicers to a PowerPivot report.
This post covers how to format slicers in Excel 2010 – in particular, how to create a custom slicer style that can be applied to multiple slicers.

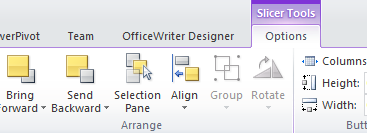
The first step is to select the slicer to activate Slice Tools tab in the ribbon.

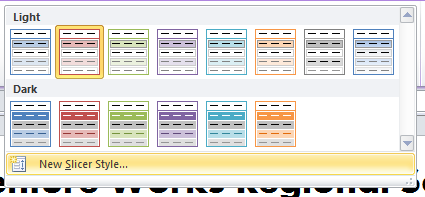
There are default styles available, but in this case we want to make a customized slicer style. You can create a new style from scratch:

But you may find it easier to clone the style and then modify the style properties, which is what we will do in this example. Here is the slicer with the unmodified clone of the style:

Continue reading PowerPivot Side Quest: How to Format a Slicer

PowerPivot Part 2: Copying PivotTable Functionality

Pitan here! This is Part 2 of my series on PowerPivot, which started with looking at how PowerPivot handles data. This time we’re covering similarities and differences between PowerPivot and regular PivotTables.

PowerPivot offers all the existing functionality of PivotTables with stronger backend support for data sources. Most of PowerPivotTables is exactly the same as regular PivotTables, but there are a few minor differences. So rather than tell you how to create PivotTables with PowerPivot, since you should theroretically be able to reuse your existing PivotTable know-how, I’m going to focus on some of the differences that threw me for a loop.

Refreshing Data

If you’re familiar with PivotTables, then you probably know that if you make changes to the original data for your PivotTable, you have to refresh the PivotTable in order to see those changes take effect.

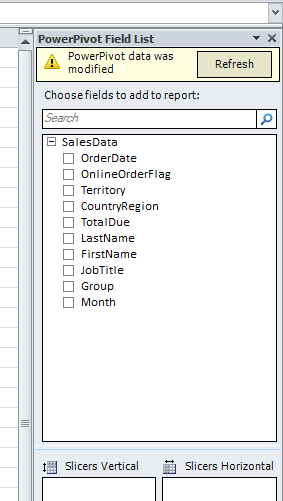
PowerPivot is no different, except that it’s a bit more explicit. When you refresh the data in PowerPivot for an existing PowerPivotTable, the PowerPivot field dialog will tell you that the PivotTable also needs to be refreshed.

It’s easy to forget that refreshing PowerPivot doesn’t refresh everything, but at least Excel constantly reminds you.
Continue reading PowerPivot Part 2: Copying PivotTable Functionality

PowerPivot Part 1: Bringing Data Together

Hello everyone, Pitan here! I’ve finally had the chance to get my head around PowerPivot, the new Excel 2010 add-in for grabbing, pivoting, and displaying data. The chronicles of my journey to set up my own PowerPivot report will be revealed in a series of blog posts over the coming weeks. Tune in as I give you some HOW-TOs with a healthy dose of side commentary!
Continue reading PowerPivot Part 1: Bringing Data Together

Everything You Wanted To Know About Power View—But Were Afraid to Ask

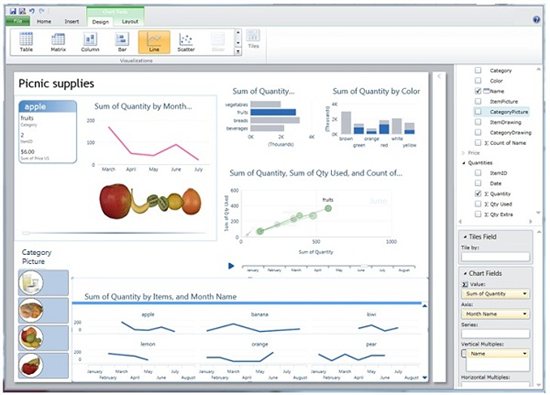
Before you decide whether Power View is the best damn thing to happen to self-service BI since graph paper or is just a smoke and mirrors, CamelCaseless extension to PowerPivot, you need to know its gist. The following blog posts and videos will give you just that, from a (mostly) business user perspective. Read ’em, and then get cracking with the CTP3 version, available for download here.

  • Dan English’s (b | t) “Intro to BI Semantic Model & Delivering Self-Service Reporting with Power View (Crescent)” video and slide deck

A comprehensive MSBI presentation that covers the BI Semantic Model concept, Power View and SQL Server Analysis Services with Power Pivot in SQL Server 2012.

Continue reading Everything You Wanted To Know About Power View—But Were Afraid to Ask

Masterpiece Theatre SharePoint: Power View and Hadoop

In this episode of Masterpiece Theatre: SharePoint, we’re talking Cresent erPower View. Press play to learn why Power View is good for PowerPivot and bad for Tableau, how it transforms big Hadoop data into technophobe-friendly animated reports and what your edition of SharePoint needs to get it up and running.

Related Posts