Tag Archives: power view

Is Microsoft Excel the Next Great Business Intelligence Tool?

Credit: http://www.pbi2.com/images/img_businessIntel.jpgWith Microsoft’s release of Office 2013now fully equipped with features such as PowerPivot and PowerView, news outlets and blogs are abuzz speculating this is a push to make Excel the next Business Intelligence (BI) tool. Software Advice sat down with Rob Collie, CTO of PivotStream and one of the founding engineers of PowerPivot, to get his perspective on how the new Excel will affect Business Intelligence and Excel professionals.

[Read the full interview here.]

Takeaways from the interview:

1. More adoption of PowerPivot in the Excel community. PowerPivot has yet to receive a lot of attention among the Excel audience. 

“Unlike programmers, BI specialists, and other IT pros, the Excel audience doesn’t congregate at conferences and they don’t closely monitor what Microsoft is saying about the next version of their toolset. Overwhelmingly, the way they learn about new Excel capabilities is by inspecting the latest version once it lands on their desktop.”

All of that is about to change now that Office 2013 has more tightly integrated PowerPivot into Excel. Originally a separate download, PowerPivot is now part of the original package upon purchase.

2. The PowerPivot community is growing.

“Using PowerPivotPro traffic as a guide, I’ve seen the PowerPivot audience double in size every year since 2009. But I’d still estimate that less than one percent of the eventual PowerPivot target audience has been exposed to the product as of today.”

3. All Office users now data analysts? Continue reading Is Microsoft Excel the Next Great Business Intelligence Tool?

Spring/Summer 2012 Conference Wishlist: DevCon, SQLBits, TechEd, and More


[Image via Huffington Post]

It’s 81 degrees out right now. In March. In Boston. We’re racing the kayaks out on the Charles this afternoon. El Niño, te amo. Nice weather tends to give me Magellan syndrome, and what better way to (semi) productively harness that than by researching cool sessions at upcoming conferences? The following were selected for their edgy subject matter. You may translate “edgy” any way you like.

I would love to see a conference devoted to SQL Azure Labs projects like Data Explorer, but that aside, I think this list sums up my current MSFT-related interests. If I’ve skipped yours, do chime in in the comments!

  • Topic: BI Reports
  • Conference: DevConnections
  • Session: Data Visualization Choices
  • By: Paul Turley (b | t)
  • Hook: Get the scoop behind Reporting Services, PowerPivot, Tabular Semantic Models, Report Builder, BIDS, SharePoint, PerformancePoint, Excel, Excel Services and the new Power View reporting tool.
  • Where: Las Vegas, NV
  • When: 3/26-3/29 (better book those plane tickets now!)
  • How much: $1595
  • Topic: Data Quality Services and Master Data Services
  • Conference: SQLBits X
  • Session: Take Good care of your Data: Introducing SQL 2012 DQS &MDS
  • By: David Faibish (in)
  • Hook: “The new exciting Data Quality Services and the improved Master Data Services in conjunction with SSIS provides the IT and IW with an attractive solution that allows full lifecycle data management.”
  • Where: Novotel London West, London
  • When: 3/29 (yep, same “buy those tickets stat” admonishment!)
  • How much: £350.00
  • Topic: Azure
  • Event: Windows Azure Kickstart
  • Hook: “You have chance to spend a day with some of the nation’s leading cloud experts and to learn how to build a web application that runs in Windows Azure. “
  • By: Microsoft Azure team
  • Where: Minneapolis, Independence, Columbus, Overland Park, Omaha, Mason, Southfield, Houston, Creve Coeur, Downder’s Grove, Franklin, and Chicago
  • When: 3/30-5/8 (check the listing for your city’s date)
  • How much: Free
  • Topic: Hadoop on Azure
  • Conference: Hadoop Summit
  • Session: Unleash Insights on All Data with Microsoft Big Data*
  • By: Alexander Stojanovic (b| t)
  • Hook: “Accelerate your analytics with a Hadoop service that offers deep integration with Microsoft BI and the ability to enrich your models with publicly available data from outside your firewall. “
  • Where: San Jose Convention Center
  • When: 6/13-6/14
  • How much: $499 (until 3/31), $599 (4/1-6/3), $700 (on-site)
  • Topic: Exchange 2010 SP2
  • Conference: TechEd Europe
  • Session: Microsoft Exchange Server 2010 SP2: In’s and Out’s
  • By: Exchange Product Team
  • Hook: “Come and see how we have tamed this beast and turned it into something even your own mother could understand.”
  • Where: Amsterdam RAI
  • When: 6/26-6/29
  • How much: €1,695 + VAT (before 3/31), €1,995 + VAT (after 3/31)


*Sessions for Hadoop Summit are selected by the community. Results coming soon.

Boston SharePoint Salon: Go Big or Go Home

Big as in data, home as in “out of business.” Because there’s only going to be more data, and people are finally realizing that not only can it be sliced and diced and visualized in formats comprehensible to the business analyst—it needs to be. The questions are: how should it be stored and queried and where should the visible representations of these queries be displayed?

Hadoop, Apache’s open source, distributed computing and storage framework based on Google’s MapReduce model is one answer to the first question. Or you could buy a supercomputer, but, those are kind of expensive! And less fun to say!  As for the second question, of course the answer depends on the type of data. As this is a SharePoint-focused Salon, though, I’m going to nominate SharePoint as one potential answer. Why? Well, Microsoft’s new Big Data Solution will put enterprise Hadoop solutions on Azure and Windows Server, including the now available SQL Server Connector, which lets you transfer data between Hadoop and SQL Server.  So, if you plan on upgrading to SQL Server 2012, you’ll be able to access data stored in Hadoop from SharePoint, and do all your slicing and dicing and displaying in PowerPivot and Power View. Presumably.

Interesting, no? We think so. If you agree, please join us at Tico (Berklee Street) this Thursday, from 7 to about 9:30 pm. You can RSVP here, or email me! And if you can’t make it, but know someone whom you think should attend, please spread the word!

Boston SharePoint Salon Recap: Powerview and Fall in a Glass

Cross-posted from bostonsharepointsalon.com:

Last night’s Salon was, by I want to say all accounts, a rather smashing success. (Perhaps a smashed success for a few philosophes.) About twenty locals, newbies and visitors braved the seriously odious weather to talk about, among a few many other things, Power View and the revamped BI Stack. Many many thanks to Sean Boon (b | t), from Microsoft’s Power View team, for coming all the way from Providence on a tweet’s notice—your inside expertise was much appreciated!

If you’d like to come to the next Salon, consider this your invitation! It’ll happen sometime in mid-December–stay tuned for specifics!

Everything You Wanted To Know About Power View—But Were Afraid to Ask

Before you decide whether Power View is the best damn thing to happen to self-service BI since graph paper or is just a smoke and mirrors, CamelCaseless extension to PowerPivot, you need to know its gist. The following blog posts and videos will give you just that, from a (mostly) business user perspective. Read ’em, and then get cracking with the CTP3 version, available for download here.

  • Dan English’s (b | t) “Intro to BI Semantic Model & Delivering Self-Service Reporting with Power View (Crescent)” video and slide deck

A comprehensive MSBI presentation that covers the BI Semantic Model concept, Power View and SQL Server Analysis Services with Power Pivot in SQL Server 2012.

Continue reading Everything You Wanted To Know About Power View—But Were Afraid to Ask

Boston SharePoint Salon: Power View and Visualization

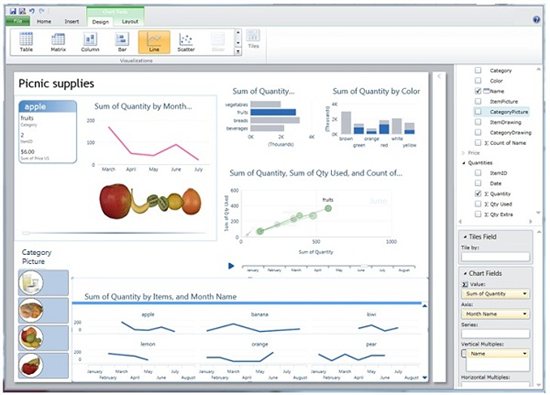
PowerPivot, Windows 8 Metro tiles, Office 365, Power View… if there’s one category of user Microsoft seems to building its future upon, it’s the business user. And by business user, I mean a given employee who needs to analyze and interpret data without writing a single query. Without even needing to know that “query” has a technical definition. For years, Excel was the only answer MSFT provided, but many of today’s business users want to be able to not only analyze but interact with data; and the data needs to be dynamic, and thus is optimally accessed from the browser. Enter: visualization, which is an interactive, abstracted visual representation of a given data set.Power View, née Project Cresent, is Microsoft’s new visualization application, and it sits inside SharePoint Server 2010. With Crescent, users can turn tables of data from PowerPivot workbooks or SQL Server 2012 instances into interactive charts, tiles and other vizualizations.
At the October Boston SharePoint Salon (BoSS), we’ll be talking Power View and the dataviz trend in general, its impact on database devs and admins, how it may play out in Office 15 and the next version of SharePoint and how many Euros, approximately, it takes to smuggle 20 kilos of guanciale past customs. Cool? Cool.
BoSS is happening at Eastern Standard, home of the Frobisher. If you want in, invite yourself on Facebook or @ me on Twitter.  See you there!

Masterpiece Theatre SharePoint: Power View and Hadoop

In this episode of Masterpiece Theatre: SharePoint, we’re talking Cresent erPower View. Press play to learn why Power View is good for PowerPivot and bad for Tableau, how it transforms big Hadoop data into technophobe-friendly animated reports and what your edition of SharePoint needs to get it up and running.

Related Posts