PowerPivot Part 3: Slicers

Hello everyone, Pitan here! This is the third chapter of my PowerPivot epic. Read the adventure from the beginning with PowerPivot Part 1: Bringing Data Together or continue on to your regularly scheduled programming with slicers!

Okay, so technically slicers aren’t specific to PowerPivot, but they are new to Excel 2010. Chances are if you are working with PowerPivot, you’ll want to know about slicers.

What is a slicer?

A slicer is a visual representation of a filter applied to your PivotTable or PivotChart. Rather than having to use the drop-downs for report filters, column labels, or column rows like this:
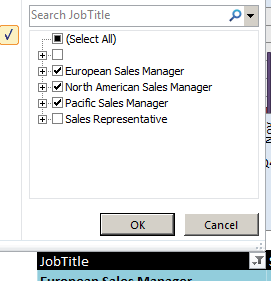
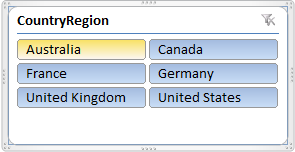
You can have an aesthetically pleasing slicer to show you at a glance what data is filtered:
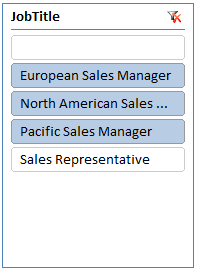
How do slicers work?

Continue reading PowerPivot Part 3: Slicers

PowerPivot Side Quest: How to Format a Slicer

Pitan here! In Part 3 of my PowerPivot blog series, I cover how to add slicers to a PowerPivot report.
This post covers how to format slicers in Excel 2010 – in particular, how to create a custom slicer style that can be applied to multiple slicers.

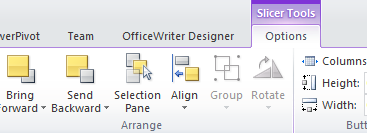
The first step is to select the slicer to activate Slice Tools tab in the ribbon.

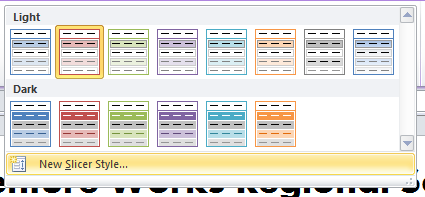
There are default styles available, but in this case we want to make a customized slicer style. You can create a new style from scratch:

But you may find it easier to clone the style and then modify the style properties, which is what we will do in this example. Here is the slicer with the unmodified clone of the style:

Continue reading PowerPivot Side Quest: How to Format a Slicer

Consumed: SoftArtisans News & Music

With Boston’s Ad Club EDGE conference* still fresh in my mind and inspired by Riparian Data’s (shout out to the talented Claire) blog post on what they’re reading, I set out to discover what consumes SoftArtisans.

The questions:
 1. What article did you read this morning?
2. What are you listening to right now?
 
The answers:
Jim, Systems Administrator
Offloaded Data Transfer in Microsoft Windows Server 2012 Beta – Dell TechCenter blogs
TechEd North America 2012 Keynote
Christina, UX Engineer
What the Rise of Depeche Mode Teaches You About the Rise of Digital Design – Fast Company
We are Beautiful, We are Doomed – Los Campesinos!
Dan, VP of Operations
WSOP Day 17 Recap: Ohel, Gathy Win Bracelets, Ivey Leads Omaha Hi-Lo
Tear It Up – Jerry’s Kids

Continue reading Consumed: SoftArtisans News & Music

Creating Dynamic Menus in VBA Add-Ins

With the new release of OfficeWriter 8.1’s designer ribbon, I’ve been working more with the ribbon interface. This is a follow up post to one written previously on updating an old Office Add-In to use the new ribbon interface. In this post we’ll explore how to create dynamic menus in VBA Add-Ins.

Once you have the ribbon for a VBA Add-In, there are a number of things you can add to make the UI more useful.  One of the more versatile elements available is the dynamic menu.  This menu lets you change it during runtime!  Unfortunately, working with it in VBA is a little strange.

First add the base xml to the ribbon xml like you would for any UI element.


<group label=”Ribbon Group” id=”group1”>

<dynamicMenu label=”Dynamic Menu” id=”menu1″
imageMso=”TableInsert” getContent=”ReloadMenu”/>
</group>

The important attribute here is “getContent”.  This is a callback to a method in the VBA which will create the items for the menu.  The method will literally create xml for a menu from scratch and return it.  Anything that can normally be in a menu can be added this way – including buttons, submenus, and separators.  The sample code below creates a button and a submenu with another button inside it. Continue reading Creating Dynamic Menus in VBA Add-Ins

PowerPivot Part 2: Copying PivotTable Functionality

Pitan here! This is Part 2 of my series on PowerPivot, which started with looking at how PowerPivot handles data. This time we’re covering similarities and differences between PowerPivot and regular PivotTables.

PowerPivot offers all the existing functionality of PivotTables with stronger backend support for data sources. Most of PowerPivotTables is exactly the same as regular PivotTables, but there are a few minor differences. So rather than tell you how to create PivotTables with PowerPivot, since you should theroretically be able to reuse your existing PivotTable know-how, I’m going to focus on some of the differences that threw me for a loop.

Refreshing Data

If you’re familiar with PivotTables, then you probably know that if you make changes to the original data for your PivotTable, you have to refresh the PivotTable in order to see those changes take effect.

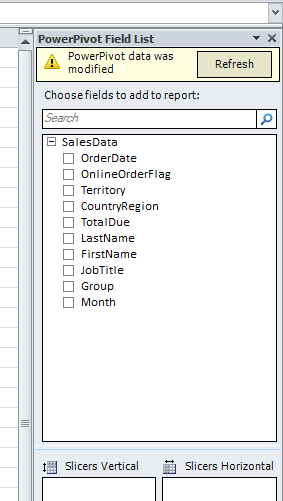
PowerPivot is no different, except that it’s a bit more explicit. When you refresh the data in PowerPivot for an existing PowerPivotTable, the PowerPivot field dialog will tell you that the PivotTable also needs to be refreshed.

It’s easy to forget that refreshing PowerPivot doesn’t refresh everything, but at least Excel constantly reminds you.
Continue reading PowerPivot Part 2: Copying PivotTable Functionality

Comparing Excel Export Functionality in SSRS 2012 to OfficeWriter

In the latest version of SQL Server, SQL Server 2012, Reporting Services now supports the Office 2007\2010 XLSX file format (aka Office Open XML file format) in its Excel renderer. In fact that is the default format for the Excel renderer. The old renderer for the legacy Excel 2003 XLS format has been named to “Excel 2003” but it has been deprecated and is not visible in the available export options list by default. For reference see the related section in the MSDN documentation. Although SSRS 2012 has now the ability to export an RDL report into an Excel XLSX workbook, the Excel renderer still has certain limitations. In this blog post, we will discuss some of these limitations and compare them to the OfficeWriter renderer in SSRS.

Charts

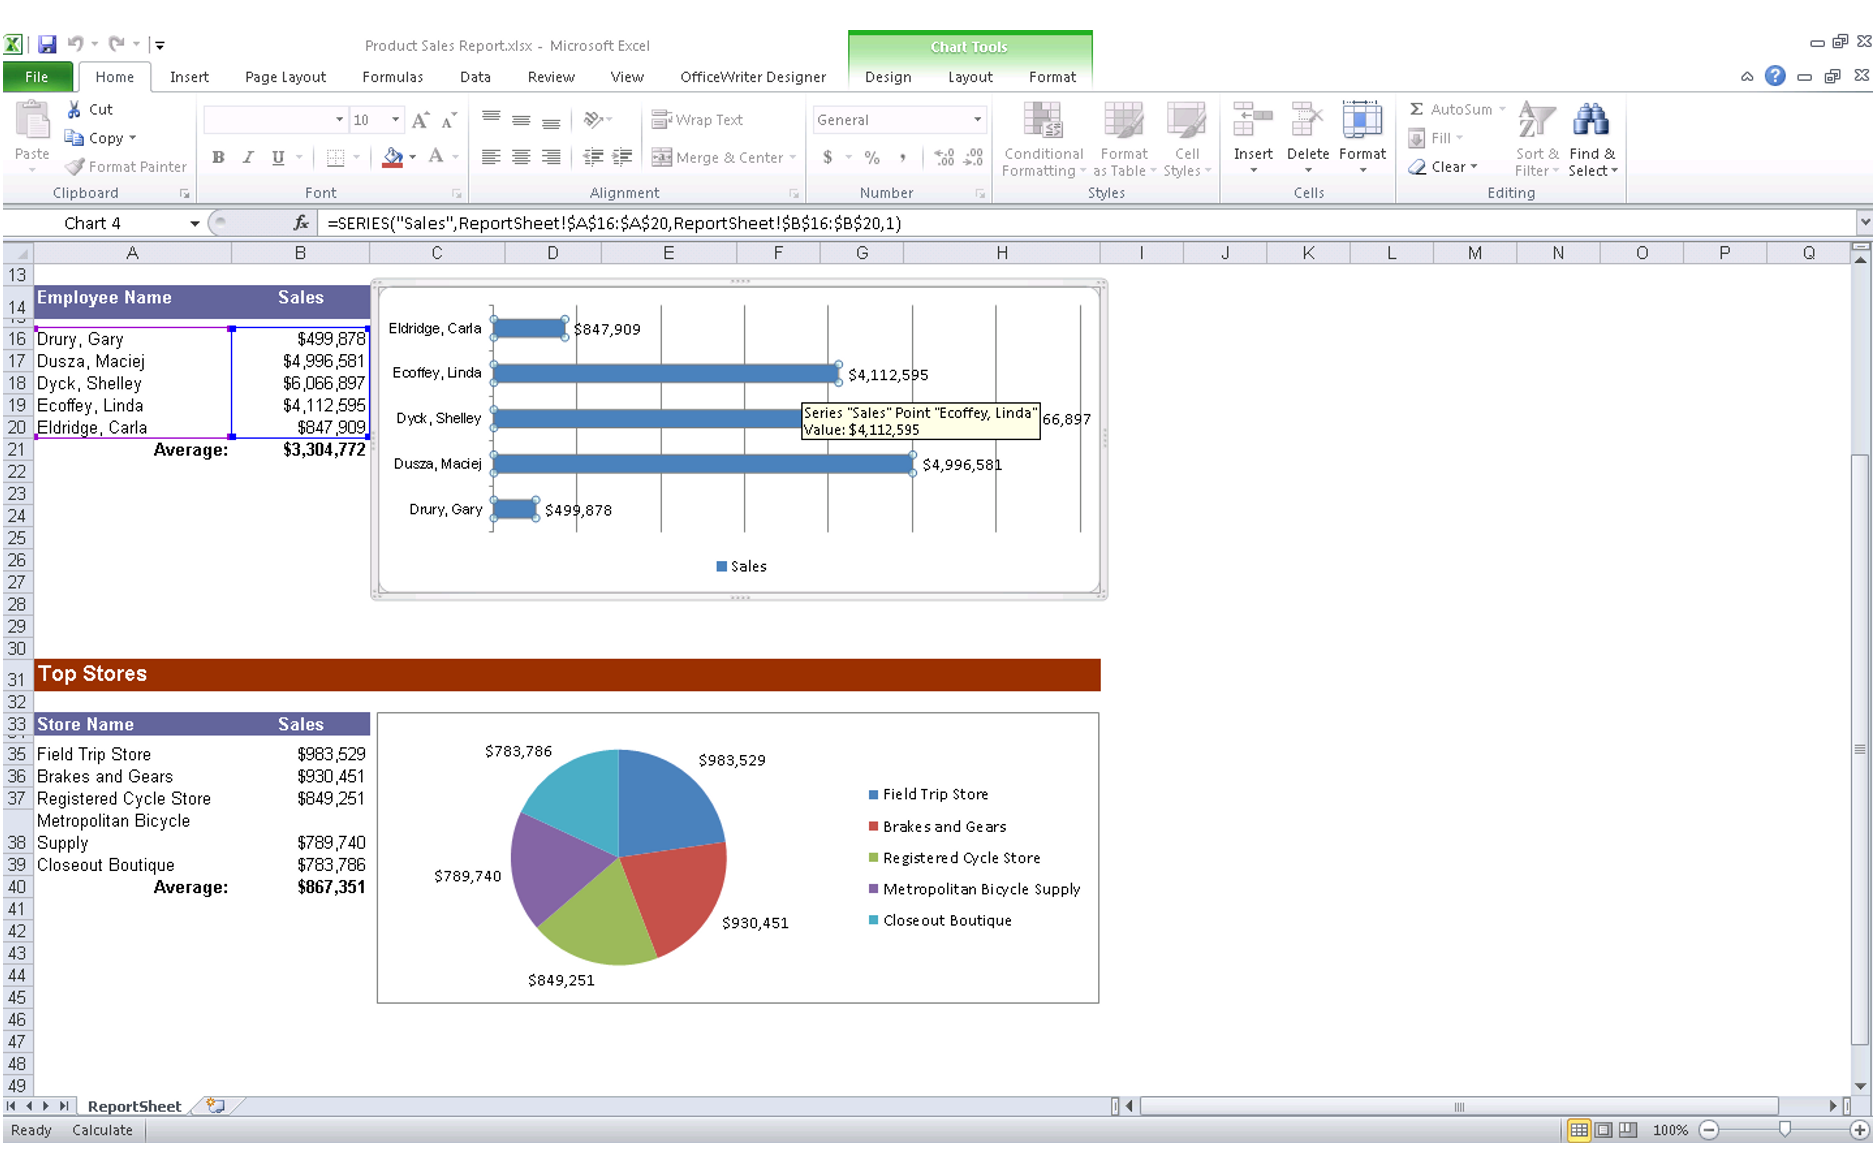
Probably one of the major limitations is that charts will be exported as pictures. In the related section in the MSDN documentation it states:

“Charts, sparklines, data bars, maps, gauges, and indicators are exported as pictures. The data they depict, such as the value and member labels for a chart, is not exported with them and is not available in the Excel workbook unless it is included in a column or row in a data region within a report.”

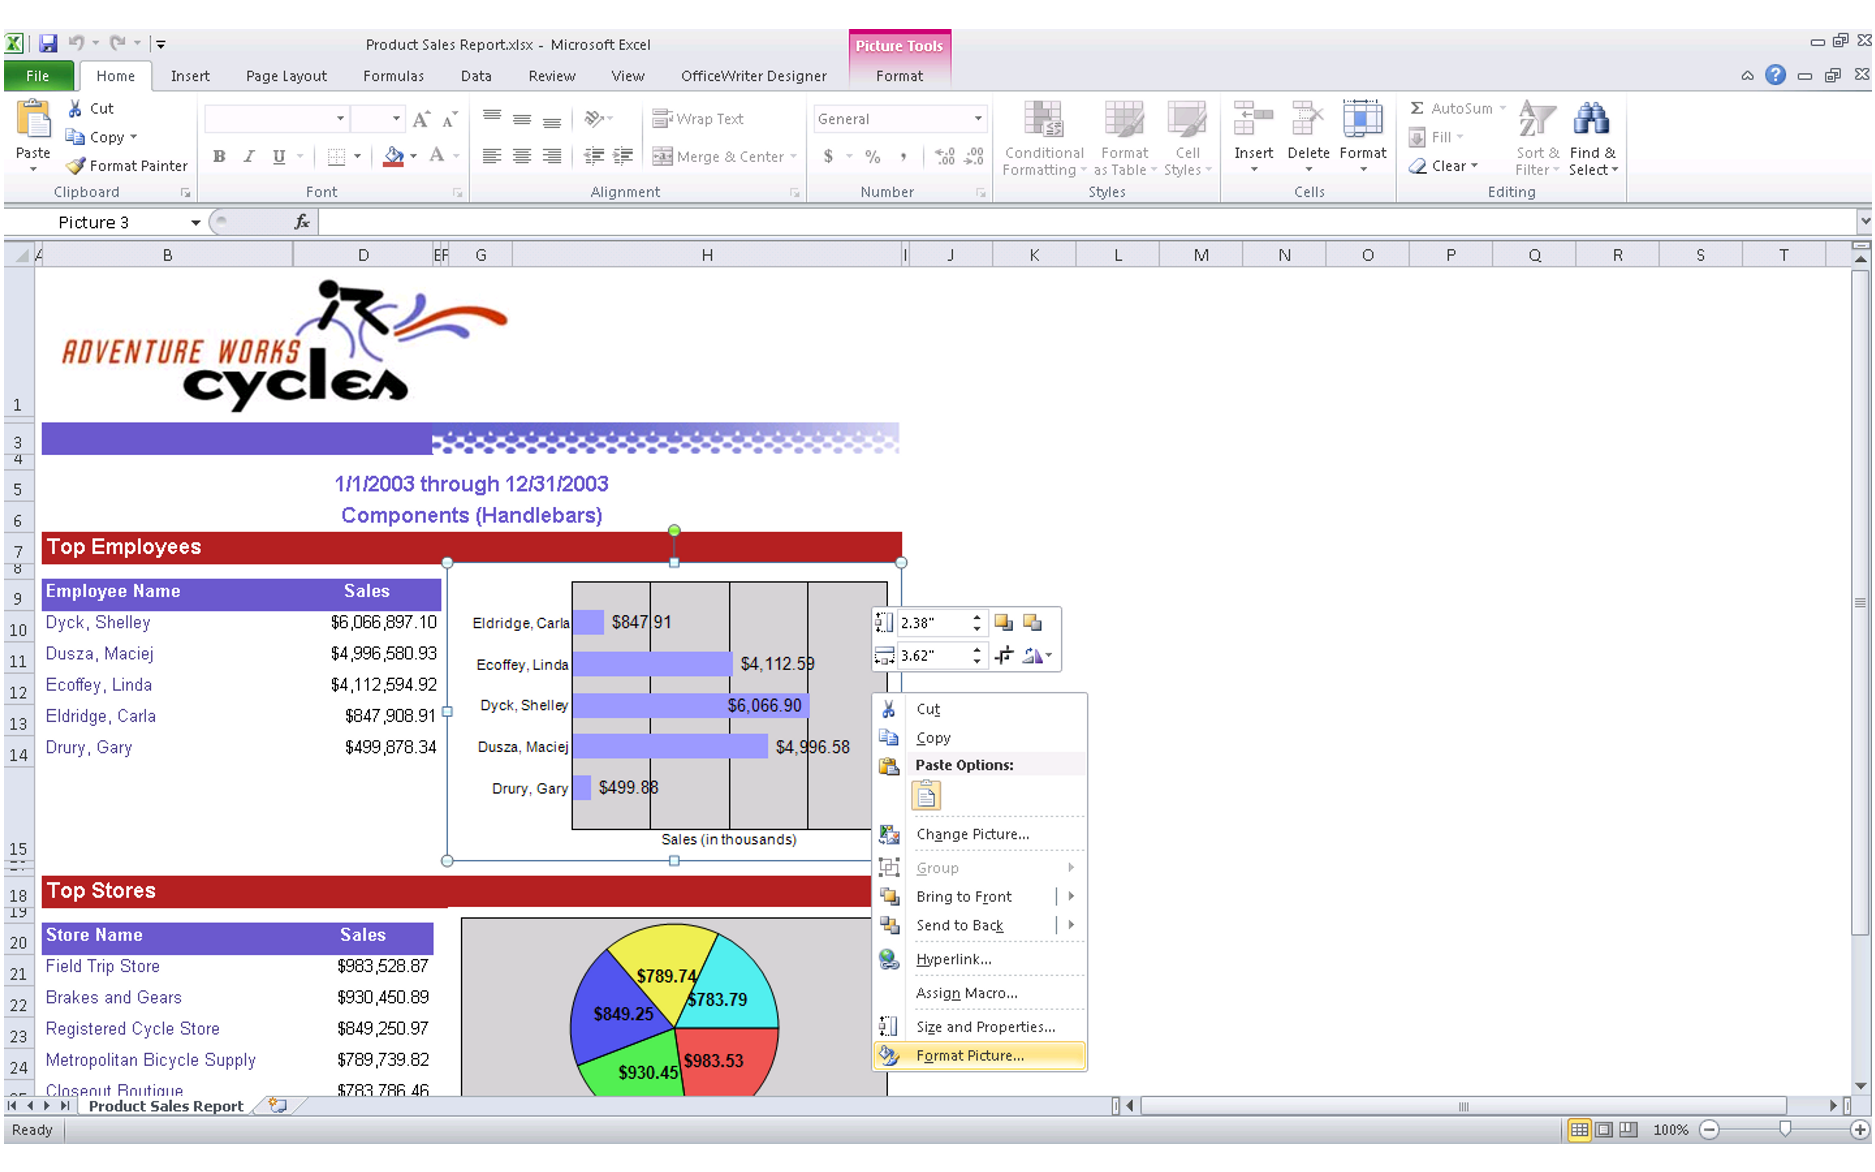
With the OfficeWriter renderer on the other hand, the charts will be native Excel charts with live data. Let’s see the difference in the following screenshots:

“Product Sales Report.xlsx” generated using the SSRS 2012 Excel renderer (note that the chart is a picture)

Continue reading Comparing Excel Export Functionality in SSRS 2012 to OfficeWriter

New SoftArtisans Website Design

So fresh and so clean. The SoftArtisans website got a makeover – nay, an overhaul. The hard work of our designers Christiana and Jon produced a site worthy of praise. No longer hosted on Yahoo!, the site features new and improved navigation, a slick layout and custom graphics in order to create a more user-friendly environment. Gone are the days of the unattractive panel menus and outdated feel. The new layout incorporates a custom slider, more ways to follow and connect with us through social media and a new theme for the blog to match. Before the site’s demise, designer Christiana caught a screenshot so you could view the dramatic change. See below for the before and after shots and let us know your thoughts in the comments section.
Continue reading New SoftArtisans Website Design

Meet the Team: Whitney

Hello and welcome to our Meet the Team series, in which we aim to give you deeper insight into the minds and personalities of those who make up this eclectic, close-knit group. We are developers, marketers, and technical support engineers, and at work we craft everything from Microsoft reporting APIs to mobile email applications. And outside of work? Let’s just say racing against the machine during hackathons, building architecturally sound beer towers during retros, and paddling down the Charles during the warmer months are simply the beginning.

This week we caught up with Support Engineer, Whitney.

1. What do you do?
At SoftArtisans, I’m a developer and I fight with C# all day.  Outside work I have far too many hobbies to fit into my spare time.*

2. What are you listening to right now?
The Decemberists – One Engine .  I swear I liked them before The Hunger Games.  …But probably not before they were cool.

3. When you were 5 what did you want to be and why?
A vet, I think?  I didn’t actually decide to get into CS until I graduated high school and had no choice but to select a major.  For something essentially pulled from a hat, it’s been going rather well.  I also contemplated being a music major for awhile, until I realized that would require practicing.

Continue reading Meet the Team: Whitney

PowerPivot Part 1: Bringing Data Together

Hello everyone, Pitan here! I’ve finally had the chance to get my head around PowerPivot, the new Excel 2010 add-in for grabbing, pivoting, and displaying data. The chronicles of my journey to set up my own PowerPivot report will be revealed in a series of blog posts over the coming weeks. Tune in as I give you some HOW-TOs with a healthy dose of side commentary!
Continue reading PowerPivot Part 1: Bringing Data Together

Blogged