Category Archives: Excel

How to import text on multiple lines in Excel

Let’s say that you have a string “Top sales person in the Central region” in your data base. You want it to look like the following in a cell in an Excel worksheet:

Highlights:
Top sales person in the Central region

How do you do this?

Splitting text over multiple lines in Excel

In order to display text on multiple lines in a cell in Excel, two conditions must be met:

  1. The cell must be formatted with “Wrap Text”
  2. The text must contain the new line character

If you press ALT+ENTER in Excel, Excel automatically formats the cell with “Wrap Text” and inserts a new line character into the cell. But this approach won’t work if you are importing your data from an outside source, for example, if you are importing data with OfficeWriter’s ExcelTemplate object.

Formatting the cell with “Wrap Text” is as easy as right clicking the cell, going to Format Cell > Alignment  and checking off ‘Wrap Text’. The next question is how to get the new line character into the cell.

Option 1: Use an Excel formula to concatenate the new line character to the text in the cell

In the example, we need to append “Highlights:” and the new character line to the text that’s already there. Let’s say that the text is in cell D8. Then the formula would be =CONCATENATE("Highlights", CHAR(10), D8). If the formula had to be applied to a series of cells, where you weren’t sure if there would be a comment or not, then you could wrap that formula in an IF formula: =IF(LEN(D8)>0, CONCATENATE("Highlights:", CHAR(10), D8), ").

What if the text from the database needed to be split over multiple lines?

Let’s suppose the text in the database already contained “Highlights”: “Highlights: Top sales person in the Central region”. Then how do you break apart the strings?

First we need to grab the “Highlights:” part. We can employ Excel’s LEFT(N_chars) function, which grabs the N left-most characters:

=LEFT(D8, 11) will return “Highlights:”

Next we need to grab just the second part. We can use Excel’s MID(text, start_index, chars) function to get a specific sub-string:

=MID(D8, 13, LEN(D8)-11) will return “Top sales person in the Central region”.

We can concatenate these together with the new line character: =CONCATENATE(LEFT(D8,11), CHAR(10), MID(D8, 13, LEN(D8)-11)). We can also wrap it in the similar IF formula if we only wanted to apply this formula if there was a comment. (Otherwise you will end up with #VALUE!).

Option 2: Add the new line character to the text that it’s imported into the file

(For example, manipulating the data in .NET code before importing it into a file using ExcelTemplate).

Just add the newline character to your text: “Top sales person in the Central region” –> “Highlights: /n Top sales person in the Central region”. When the text is imported, Excel will respect the new line character. Make sure that the cell is formatted with “Wrap Text” ahead of time.

Additional reading:

Create an Excel Spreadsheet in Powershell

This post shows you how to create an excel spreadsheet in Powershell with OfficeWriter.

PowerShell


##################################################################

##

## Create an Excel Spreadsheet with ExcelApplication in Powershell ##

## by Jim Stallings (http://www.officewriter.com)

##

##################################################################

# Add the assembly Add-Type -Path ‘C:\Program Files (x86)\SoftArtisans\OfficeWriter\bin\dotnet\SoftArtisans.OfficeWriter.ExcelWriter.dll

# Create a new ExcelApplication object

$xla = New-Object “SoftArtisans.OfficeWriter.ExcelWriter.ExcelApplication

# Create a new workbook

$wb = $xla.Create()

# Add a worksheet to the workbook

$ws = $wb.Worksheets[0]

# Add some text to the first cell in the sheet

$ws.Cells[‘A1’].Value = “Welcome to SoftArtisans OfficeWriter!

# Save the workbook to disk

$xla.Save($wb, “C:\myfile.xls“)

Stories from the WIT Trenches: Debra Dalgleish

[This is the sixth in a series of posts exploring the personal stories of real women in technology. Every woman in tech overcame at the very last statistical odds to be here; this blog series aims to find out why, and what they found along the way. If you’ve ever sought Excel-related help online or in print, chances are you’re familiar with Debra Dalgleish, one of the foremost authorities on Excel and Access development and the author of three books on pivot tables. Here, she talks staring your own home business, getting young girls aware of and excited about careers in tech and kissing correction fluid goodbye. If reading her story inspires you to share yours, please feel to email me.]

Self-employment is the dream job – most of the time. As a computer consultant, working from home, you can set your own hours, schedule meetings at convenient times, or meet with clients online. You’re the boss, so you can pass on projects that don’t appeal to you, if your workload gets too high.

If you have a young family, running your own computer-based business can give you more time with the children, while still earning an income. That’s why I got started, and now, even though the children have moved out, I wouldn’t want any other job.

My work, as an Excel and Access developer, is challenging and rewarding. My clients bring interesting projects, and push me to continue to improve my skills. In this business, there’s always something new to learn. Continue reading Stories from the WIT Trenches: Debra Dalgleish

Creating a % of Total Column with ExcelWriter

Intro

This is the final post in a 3-part series on creating % of Total columns in Excel spreadsheets. A % of Total column displays values as a percentage of the total sum of the values in that column. I’ve already touched on how to do this with static data in Excel and also with a pivot table.

For those who might be new to ExcelWriter, ExcelTemplate, and data markers:

ExcelWriter’s ExcelTemplate method of creating Excel files is to design a template in Excel that contains data markers. Data markers are cell values that begin with %%= or %%=$ that specifies a database column, variable, or array to insert into the spreadsheet column. ExcelWriter does this by inserting a new row into the worksheet for each row of data being imported. When this happens, ExcelWriter updates the references to the cells that are affected by the row insertion.

Solution

For this exercise, I’m starting out with a simple table that’s has a Format as Table table style applied. Column C contains our sales data. Columnd D will be the % of Total column. The table header row is row 4 and the data marker row is row 5. Note that we have data markers %%=Data.StoreName and %%=Data.StoreSales to import the Store Name and Store Sales columns from the data source. The total row is computed with formulas =SUM(C5:C5) and =SUM(D5:D5). The data marker and total rows have been pre-formatted with currency and percentage number formats.

Continue reading Creating a % of Total Column with ExcelWriter

Adding a % of Total Column to a PivotTable

Intro

A customer recently asked for some help with adding a % of Total column for sales data without a pivot table (read about it with Excel and with ExcelWriter). But I wanted to see how the same table and column would be done with a pivot table. Enter Pitan, the Pivot Mage and here we go!

Solution

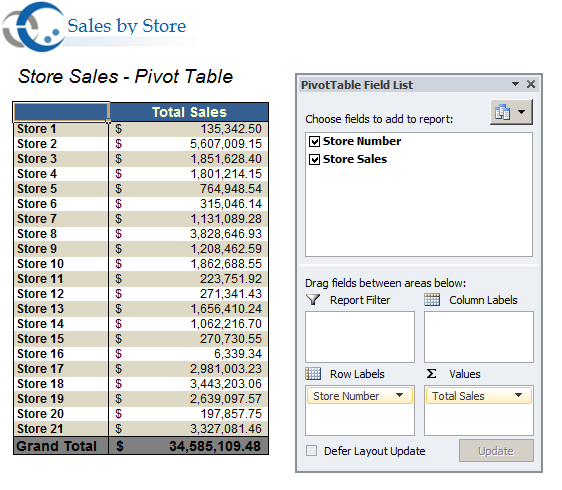
We start with a basic pivot table that already has the store names as row labels and the sales data as the data values. We want to add a column that shows each stores’s sales totals as a percentage of the sales total over all the stores.

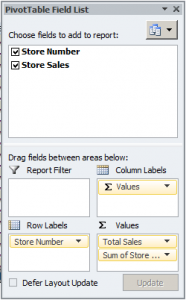
1. Add a duplicate column of the values that you want to show the percentages for. In this case, it’s “Store Sales”, so there will be two columns of “Stores Sales”: one for displaying the raw values and one for calculating the percentages.

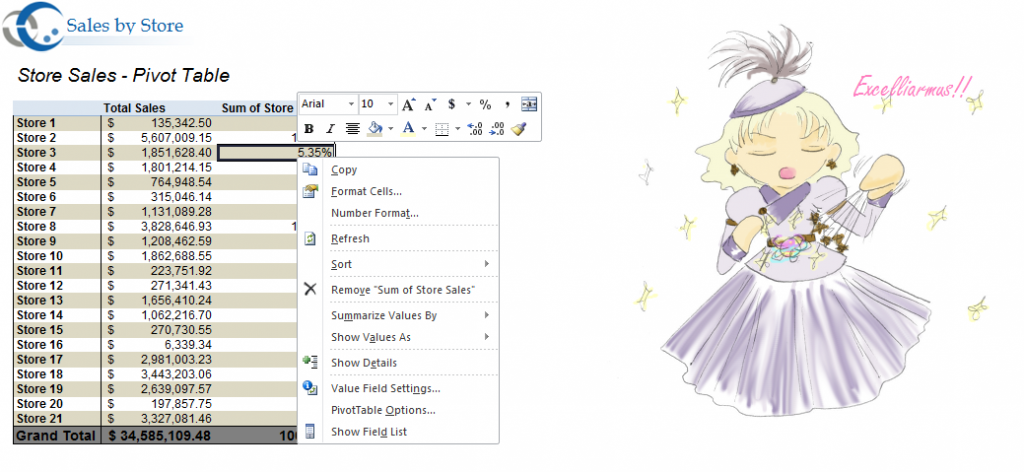
2. Display the field values as % of Column Total. This can be done two ways:

  • Right click on the field > Show Values As > % of Column Total
  • Use Value Field Settings to format the field
    1. Go to the field in the field view
    2. Select ‘Value Field Settings’ from the drop down
    3. Go to the Show Values As tab
    4. Select % of Column Total


3. (Optional) Rename the field as desired (from Value Field Settings)

4. Congratulations!

For more information about different field calculations, see Microsoft’s article on how to Calculate values in a PivotTable Report.


Creating a ‘% of Total’ Column in Excel

Intro

A customer came to me recently with the following request:

I have a fairly simple question, but cannot seem to make it work. I’m creating a simple table in OfficeWriter Excel. One column outputs general sales dollars. I’m trying to create a column next to it that will populate the % of the total sales for each row. So, it will look like this:

Store Sale $ % of Sales Total
Store 1 $2500 50%
Store 2 $2500 50%

Excel Pivot Tables can do this easily using the Field Value Settings, however, I’m creating a simple table and NOT a pivot table. Any help would be great.

We’re going to start by walking through how to create a % of Total column in Excel with static data. Read how to do this in a pivot table and with ExcelWriter data markers .

Solution

We start with a basic table that has the total sales for a number of stores. We want to add a column that shows each store’s sales total as a percentage of the sales total over all the stores. Continue reading Creating a ‘% of Total’ Column in Excel

Exporting SQL Server Database Data to Excel

Introduction

The need to get business data from a SQL Server database (or any other kind of RDBMS for that matter) into Excel for further analysis is universal.  I would venture to say that anyone in any business role from marketer to analyst to salesperson to executive to program manager has had the occasion to say: “I need this data in Excel so that I can crunch it!”

Since getting data into Excel is a common requirement, it stands to reason that there are several different ways to accomplish the task.  For simple, non-stylized, or purely tabular data imports (situations where you don’t really care about styles or fonts or corporate branding) Excel’s out-of-the-box data import solution can be an option.  For more sophisticated scenarios that require a specific look and feel, or something more complex than just straight tabular data dumps there is OfficeWriter.

This article will discuss both methods for getting your data from SQL Server into Excel.

Methods for Exporting Database Data to Excel

As I mentioned there is more than one way to skin the cat here.  Which method you choose depends on what you need to accomplish.

Method 1: Excel-based data access

Continue reading Exporting SQL Server Database Data to Excel

Downloading Excel file: Internet Explorer cannot download ‘page’.aspx

Once upon a time…

I was helping a customer with his web application, which was dynamically generating Excel workbooks, but he was running into a complication that was happening on his site but not others. On this particular site, every time he tried to download one of the workbooks, he got the following error message from Internet explorer:

Internet Explorer cannot download <page name>.aspx from <server>. Internet Explorer was not able to open this Internet site. The requested site is either unavailable or cannot be found. Please try again later.

Oh, goodness.

The plot thickens…

This message can occur if Internet Explorer attempts to open a downloaded file in Office, but is unable to save the file to the local cache directory. The most common reasons for the behavior are: Continue reading Downloading Excel file: Internet Explorer cannot download ‘page’.aspx

How to Create a Renewal Forecast Report with CRM, ExcelWriter and SharePoint

After finishing off our ASP.NET, SQL, and ExcelWriter training, the Technical Services Interns were given a project to create a proof of concept involving the dynamic generation of internal reports. We would use our new SQL knowledge to pull data from a customer relations database (Microsoft CRM), our ExcelWriter knowledge to create a rich Excel report from that data, and our ASP.NET skills to create a Web Form whereby users could constrain the reports they received. The reports would then be ported into SharePoint webparts. The reports were split into three categories:

  • Renewal Forecast
  • Case Distribution
  • Customer Activity

This post addresses the first of these reports. The Renewal Forecast report gives a company’s Sales and Support departments insight into customer contracts coming up for renewal.

Creating the Renewal Forecast Report

The purpose of this report is to provide a detailed overview of customers’ support contracts that are nearing expiration so employees can better manage the renewal process. The front-end in SharePoint is customizable so the report is generated completely dynamically and populated using queries from CRM. It is all ASP.NET code and uses a very sharp looking jQuery datepicker. Of course, the report generation is handled nicely using an ExcelWriter template. Not a current ExcelWriter user? No problem: you can download a free evaluation and follow along! Continue reading How to Create a Renewal Forecast Report with CRM, ExcelWriter and SharePoint