Process Monitor is a great tool that can help you troubleshoot applications when error messages alone just aren’t enough information to solve a problem. Process Monitor works by logging in-depth about the actions of particular processes. It will give you in-depth information about file access, registry access, threading, and permissions. In this how-to tutorial, we will show you how to collect information on the process that ASP and ASP.NET web applications run on – wpw3.exe.
Step 1: Download Process Monitor
You can download Process Monitor here. http://technet.microsoft.com/en-us/sysinternals/bb896645.aspx
Step 2: Open Your Web Application
Go to the page in your web application before your error occurs. You need to be easily able to trigger the event that causes the error while ProcMon is running to avoid collecting too much information.
Step 3: Monitor the w3wp.exe Process
- Reset the filter by clicking Filter -> Reset Filter
- Add the w3wp.exe process to the filter by going to Filter -> Filter…
- A dialog box will appear.
- Create a rule that says “Process Name is w3wp.exe”
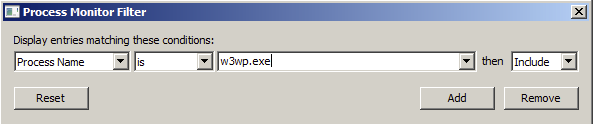
- Click “Add”
- Click “Apply” and then “OK” to exit the Dialog
Step 4: Collect Information from ProcMon
- Please make sure that the Capture icon (shaped like a magnifying class) is enabled. There should NOT be a red “X” through it.

- Go to your web application and trigger the error.
- Once the error occurs, go back to ProcMon and click the Capture Icon to stop capturing events.
Step 5: Examine the ProcMon Logs
- The first thing you should do when examining the logs is to see if anything in the “Result” column is not “SUCCESS”. Please take notes of any warnings or errors.
- Once you find the errors, determine if they are relevant to your issue.
- If you would like to save the logs, you can by going to File -> Save.
Share the post "How to Use Process Monitor (ProcMon) to Troubleshoot Web Applications"
 Follow