SQL Blogger Superlatives

When I get into the office each morning, the first thing I do is fire up the ole Google reader and revel in (and tweet about) the bounty of new reading material. In both quantity and quality, the amount of information members of the SQL community share on a regular basis is staggering. As a former full-time blogger?, I know just how much mental effort a well-constructed blog post can demand, and the fact that many bloggers are doing this for free, on top of their not exactly insignificant day jobs, is beyond impressive.  Sooo…where I am going with this? Well, I decided (in a bout of gratitude and high school nostalgia) do write up a superlatives list, yearbook-style. Of course, as I was the sole decider, many of you may disagree with my choices. (And, as my memories of senior year are, um, rather hazy, I may have missed some vital categories.) If so, feel free to let me know in the comments!

And now, without further ado, I present the Superlative SQL Class of 2011!

Most likely to be in a rock band: Thomas La Rock


Life of the party: Brent Ozar


Continue reading SQL Blogger Superlatives

SharePoint 2010 Sandbox Solution Failure with Single Dot Path

Converting a SharePoint 2007 solution to SharePoint 2010 is straightforward. In fact, other than recompiling the Visual Studio project with the SharePoint 2010 DLLs, you do not have to do anything else at all. When it comes to deploying the solution in SharePoint 2010, you can deploy it as a farm solution or a sandboxed solution. A farm solution is the same as a SharePoint 2007 solution; it is scoped to the farm level and operates with full trust. A sandboxed solution is scoped to a site collection and is limited in capabilities, but it offers certain benefits to both farm administrator and developers. The distinction between a farm and sandboxed solution lies in the deployment process, not in the solution package (which is the same in both cases).

After recompiling a project for SharePoint 2010, I was able to deploy it successfully as a farm solution. I then attempted to deploy the same solution package as a sandboxed solution. The first step was to add the solution package to the solution store with the following PowerShell cmdlet:

add-spusersolution -literalpath C:\solutions\SoftArtisansTutorial.wsp -site http://echo/sites/postone

However, this immediately resulted in the following error:

Add-SPUserSolution : The manifest.xml file could not be found within “SoftArtisansTutorial.wsp”. Continue reading SharePoint 2010 Sandbox Solution Failure with Single Dot Path

Side-by-Side Data Markers (2 of 3)

BACKGOUND:

The ExcelTemplate method of creating Excel files is to design a template in Excel that contains data markers. Data markers are cell values that begin with %%= or %%=$ that specifies a database column, variable, or array to insert into the spreadsheet column. ExcelWriter does this by inserting a new row into the worksheet for each row of data being imported. This means that anything below the data marker in the template will be pushed down as the new rows of data are imported.

Data markers from the same data set can be placed next to each other, but placing data markers from different data sets side-by-side in an ExcelTemplate can cause extra rows to be inserted into the smaller data sets.

This series of posts explains how to get rid of the extra rows in output files that result from placing data markers side by side. If you’re not a current ExcelWriter user, you can download a free evaluation and follow along!

Part 1: Updating displayed ranges from hidden ranges

Part 3: Putting it together

Part 2: Clearing out bad content

THE PROBLEM:

ExcelWriter will try to populate any data markers that it finds in the template. This means that if the macro updates the ranges on the destination worksheet before the data markers are populated, the data markers will be displayed on the destination sheet and ExcelWriter will try to populate those data markers as well. The macro will still update the ranges, but it will just write over the bad formatting, so the end result still has extra rows: Continue reading Side-by-Side Data Markers (2 of 3)

Using the BlackBerry MDS-CS Simulator

Using the BlackBerry MDS-CS Simulator

Mobile Data System Connection Services (MDS-CS) is a BlackBerry Enterprise Server (BES) component that acts as a “gateway” between BlackBerry users and local network resources (i.e. intranet, SharePoint, file shares). RIM offers the MDS-CS component of BES as a free-standing simulator. This allows developers to test an application (that requires network access) against different modeled BlackBerry simulators without the complication of connecting each simulator to the BES. The easiest way to begin using the MDS-CS simulator is to download a BlackBerry JDE which includes the MDS-CS simulator and a variety of BlackBerry simulators.

Using MDS-CS Simulator packaged in the JDE Continue reading Using the BlackBerry MDS-CS Simulator

Side-by-Side Data Markers (1 of 3)

BACKGOUND:

The ExcelTemplate method of creating Excel files is to design a template in Excel that contains data markers. Data markers are cell values that begin with %%= or %%=$ that specifies a database column, variable, or array to insert into the spreadsheet column. ExcelWriter does this by inserting a new row into the worksheet for each row of data being imported. This means that anything below the data marker in the template will be pushed down as the new rows of data are imported.

Data markers from the same data set can be placed next to each other, but placing data markers from different data sets side-by-side in an ExcelTemplate can cause extra rows to be inserted into the smaller data sets.

This series of posts explains how to get rid of the extra rows in output files that result from placing data markers side by side. If you’re not a current ExcelWriter user, you can download a free evaluation and follow along!

Part 2: Clearing out bad content

Part 3: Putting it altogether

Part 1: Updating Displayed Ranges from Hidden Ranges

THE PROBLEM:

Putting data markers from different data sets next to each other can be tricky, especially when the data sets are different sizes. ExcelWriter will automatically insert enough rows to accommodate the largest set of data. This means that sometimes, it ends up looking okay. Continue reading Side-by-Side Data Markers (1 of 3)

Pivot Tables Version Nightmare

Pivot tables can be tricky by nature and a significant portion of my support work has been dedicated to helping customers incorporate pivot tables with ExcelWriter.

One customer wrote in with the following issue: his client had recently imposed a constraint that all reports had to be in the .xls format, so he needed to convert several OfficeWriter reports designed in Excel 2007 to the 2003 format, but he was having trouble switching the pivot tables.

When he tried to save the 2007 format report as a 2003 format report, the pivot tables were locked in a read-only state, wherein users could only edit the pivot tables if the report was resaved in the 2007 format. After doing some testing in Excel 2003 and 2007, I found that this was the native behavior for Excel files as well. Continue reading Pivot Tables Version Nightmare

Adding Headers to a Grouped Spreadsheet

Introduction

In previous blog posts, I showed how José and Jillian, salespersons with PostOne Bicycles, used the new %%group marker to group and nest hierarchical data from a flat data set. In this tutorial, they will expand upon the concept by introducing headers to help separate each group, using the %%value() marker to show data values in headers and the (hide) modifier to hide data that is already shown in a header.

If you’re not a current ExcelWriter user, you can download a free evaluation and follow along!

Setup

This tutorial uses the same code and data as the original blog post. The template used in this tutorial starts where the previous blog post left off.

Adding Headers

Headers in ExcelWriter grouping and nesting are repeated for every new value in a grouped column. José marks the beginning of a header block is by using a %%header marker; the block is marked by the next %%header block (if you have nested headers) or the data marker row, as in this case. Continue reading Adding Headers to a Grouped Spreadsheet

OfficeWriter and .NET 4.0: Resolving System.Web Dependency

Recently I had a customer who was trying to use OfficeWriter with .NET 4.0 and kept receiving the error:

Warning MSB3253: The referenced assembly “assembly name” could not be resolved because it has a dependency on “System.Web, Version=4.0.0.0, Culture=neutral, PublicKeyToken=b03f5f7f11d50a3a” which is not in the currently targeted framework “.NETFramework,Version=v4.0,Profile=Client”. Please remove references to assemblies not in the targeted framework or consider retargeting your project.

The application was being compiled to the .NET 4.0 Client Profile. An application that targets the .NET Framework 4 Client Profile installs the minimum set of client assemblies on the user’s computer, without requiring the full version of the .NET Framework 4 to be present+.+ This is a problem because the System.Web assembly is not included—but OfficeWriter has a dependency to System.Web (which is not available in the Client Profile).

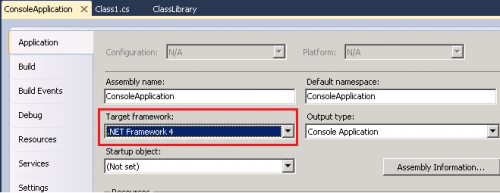
The solution: you will need to build your console application against the full .NET 4.0 Framework, because of the dependency on System.Web

To do this, just right click on your project in the solution explorer, go to properties and set the target framework under the application tab to .NET Framework 4.

Just rebuild your application and you should be good to go.

Excel Binary HFPicture Record: Parsing Pictures in Headers and Footers

We have recently added support for inserting and retrieving images from headers and footers section of an Excel spreadsheet. To enable this, we needed to parse the HFPicture records, which turned out to be a difficult task, especially due to lacking documentation.

When a user adds a picture to a worksheet header or footer section, there is no change to the HEADER or FOOTER records (except for the addition of the &G or &[Picture] tokens to the text). So how are the pictures added to file, and how are they linked to the specific header or footer section?

Let’s start by examining the HFPicture record – we will find that, oddly enough, the HFPicture record is simply a wrapper around the DGContainer or the DGGContainer. Which of these it is is determined by the HFPicture’s fIsDrawing and fIsDrawingGroup bits, and if this HFPicture record is a continuation of a previous HFPicture (due to the size limit of the records), the bit fContinue will also be set. Therefore, an image in a header/footer section will be represented very much like regular images. Continue reading Excel Binary HFPicture Record: Parsing Pictures in Headers and Footers

Grouping and Nesting on Multiple Columns

Starting in version 7.1 of ExcelWriter, you can use grouping and nesting markers to display flat data in a grouped and nested format using the ExcelTemplate object and a OOXML (.xlsx) template. Not a current ExcelWriter user? No problem: you can download a free evaluation and follow along!

Introduction

In my previous post, I showed how José, a salesperson at PostOne Bicycles, was able to easily pick out the sales made by the sales team in different regions by using a %%group marker. His coworker, Jillian, wants to go further than that, breaking down sales first by region, then by Salesperson, so that she can see from a glance whose sales are strong or weak in each region, and whether she needs to improve her performance. That’s easy to do thanks to the nesting feature of ExcelTemplate grouping and nesting.

Nested grouping with multiple groups

Jillian can group by multiple columns with nesting by placing additional %%group markers in more columns. Continue reading Grouping and Nesting on Multiple Columns

Blogged