Category Archives: OfficeWriter

NEW OfficeWriter ASKs Forum

You have opinions and we want to hear them. That’s why we’ve created OfficeWriter Asks, a new forum where you can post all of your feedback and wishlist items. Our aim: to bring you the features you desire. Each week we’ll pose a new question related to our OfficeWriter product and how we can improve upon the features you use and need.

This week on OfficeWriter Asks:
  • Pivot Tables
    Love them? Hate them? How do you use them? 


New in OfficeWriter 8.3: Auto Filters and More!

OfficeWriter 8.3 is filled with exciting new features. Here are some of our favorites:

Auto filters in ExcelApplication

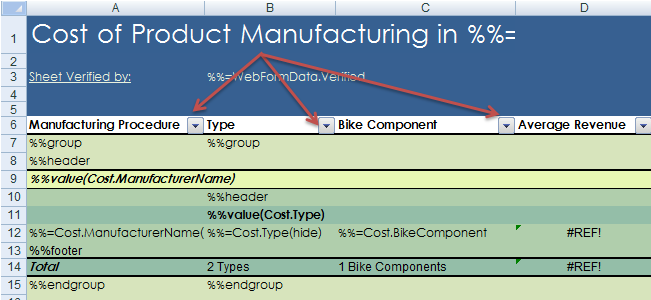
Auto filters are an easy way to view and filter data in a worksheet, and now you can add them programmatically with ExcelApplication in XLSX and XLSM files!

All you need to do is create an area on the worksheet where you want the auto filter to be, then apply the auto filters to that area. This works on data sets that already have data, and data sets that just have ExcelTemplate data markers.

wksht.AutoFilter.Area = wksht.CreateArea("A6:D14");

Remember, you only get one set of auto filters per worksheet, so if you set the auto filter to a new area, you’ll lose your original filters. Continue reading New in OfficeWriter 8.3: Auto Filters and More!

Everything You Need to Know About OfficeWriter: The Whitepaper

Looking for a comprehensive overview of OfficeWriter? You’ve come to the right place. We’ve partnered with Andrew Brust of Blue Badge Insights to give you an inside look at how OfficeWriter can benefit your company’s business intelligence.
OfficeWriter Whitepaper
Microsoft Office and Data: A Love Story
Excel and Word are the Will and Kate of the Office software world, but if you try to use them for data analysis, they’ll morph into Milli-Vanilli. OfficeWriter prevents that from happening.
In this whitepaper, you’ll learn:
  • How OfficeWriter’s API and templates provide bridges between Microsoft Office & databases
  • How OfficeWriter enhances SQL Server Reporting Services
  • How OfficeWriter turns SharePoint lists & libraries into full-fledged Office docs
That is simply the beginning. Get a full overview of OfficeWriter today.

Outlining Excel Reports with ExcelWriter

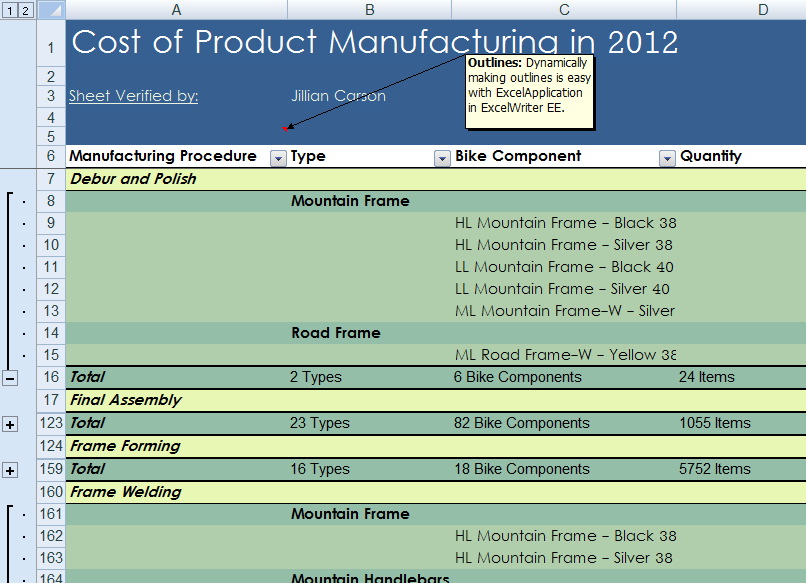
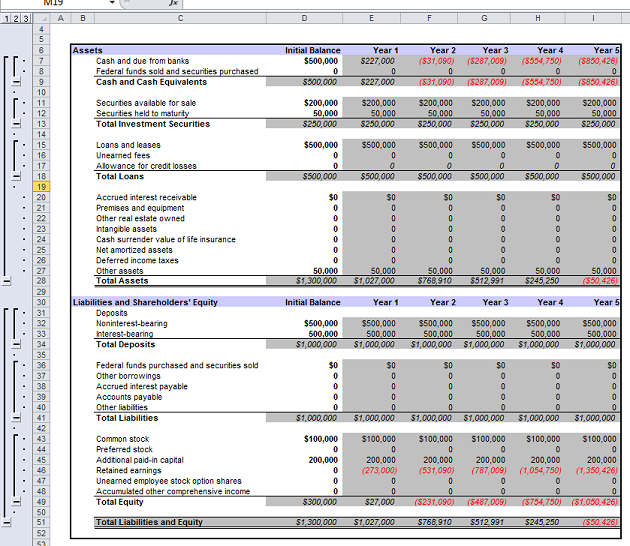
Outlines in Excel are a useful way to organize and present lots of data in workbooks.  ExcelWriter offers several different ways to integrate outlines into Excel reports:

ExcelWriter’s Application object (available in Enterprise Edition), provides full control to modify Excel files programmatically. This includes adding or removing Excel outlines and more:

  1. Group an area of rows or columns
  2. Read or set the level of outlining for any given row or column in a worksheet
  3. Read or set whether the group that a given row or column belongs to is expanded or collapsed
  4. Ungroup all the rows or columns in an area of a worksheet
  5. Detect where the summary rows or columns are located for all the groups in a worksheet
Sample output from ExcelApplication

Continue reading Outlining Excel Reports with ExcelWriter

Creating a Sales Pipeline Report with ExcelWriter

One of the great features of ExcelWriter is Grouping and Nesting feature of ExcelTemplate. Grouping and Nesting allows you to easily format your data in order to make it more readable. This feature is especially handy when applied to a common report, such as a sales pipeline report. Internally at SoftArtisans, we use ExcelWriter with Grouping and Nesting when generating our own sales pipeline report! By taking advantage of this feature, you can get fancier looking reports with little additional effort – ExcelWriter does the formatting work for you!

Before we begin, let me say that I will not attempt to tell you how to query your data as I’m sure everyone will be using different CRM systems. However, no matter how you’re querying your data (be it SQL, or a web service like SOAP or REST) the process is generally the same.

To start, you need to decide how you want to group your data. In most cases you’ll want to group first by month or quarter; then you could group by salesperson. These can be whatever you want, but you must have a column in your result set that will represent each.

For example, we group our own sales report data by: Continue reading Creating a Sales Pipeline Report with ExcelWriter

SPTechCon Boston 2012 Wrap Up

Going through SPTechCon withdrawals? So are we. That’s why we’re bringing you a (relatively) quick recap from the Twittosphere. We can’t thank everyone who came out to booth #505 enough. We enjoyed meeting/tweeting all of you and learning from the SharePoint community! If you weren’t able to join in the exciting conversation or view OfficeWriter demos on how it can enhance reporting with SharePoint, fear not we have more demos online and the chance to download a free evaluation of OfficeWriter so you can take it for a test drive yourself. In the interim, take a look inside the four days of sessions, networking, and SharePoint learning.

[To view the wrap up on Storify]

Continue reading SPTechCon Boston 2012 Wrap Up

SP Tech Con Prize Giveaway: Call Me Maybe?

Coming to SP Tech Con in Boston this July? Visit us at booth #505 and enter to win a POP Phone. We will be raffling off 5 POP phones throughout the conference. A throwback to the 50’s style Bakelight design phone, these plug into all mobile phones, tablets, and computers. Plus they add an additional cool factor when you’re Skyping or video chatting with friends. See below for prize giveaway details.

Prize details:

Where:

Booth #505

When:

July 24th – 25th

Tuesday, 11am – 7pm

Wednesday, 11am – 4pm

How to Enter:

Continue reading SP Tech Con Prize Giveaway: Call Me Maybe?

What’s New in OfficeWriter 8.2

[cross-posted from www.officewriter.com/blog]

We kicked off 2012 with our first maintenance release of OfficeWriter 8 back in March. Now we’re continuing the trend with our next release, OfficeWriter 8.2, just in time for the end of Q2. Let’s take a quick spin around what we’re introducing:

Support for SQL Server Reporting Services 2012

We are proud to announce that the OfficeWriter Reporting Services Integration now supports SQL Server Reporting Services (SSRS) 2012, which was released earlier this year.

You may have heard that SSRS 2012 has added some functionality to their default Excel export option, but OfficeWriter can give those rich Excel and Word features that you can’t do without. Our very own Ozgur breaks down what keeps OfficeWriter ahead of the pack. Continue reading What’s New in OfficeWriter 8.2

Creating Dynamic Menus in VBA Add-Ins

With the new release of OfficeWriter 8.1’s designer ribbon, I’ve been working more with the ribbon interface. This is a follow up post to one written previously on updating an old Office Add-In to use the new ribbon interface. In this post we’ll explore how to create dynamic menus in VBA Add-Ins.

Once you have the ribbon for a VBA Add-In, there are a number of things you can add to make the UI more useful.  One of the more versatile elements available is the dynamic menu.  This menu lets you change it during runtime!  Unfortunately, working with it in VBA is a little strange.

First add the base xml to the ribbon xml like you would for any UI element.


<group label=”Ribbon Group” id=”group1”>

<dynamicMenu label=”Dynamic Menu” id=”menu1″
imageMso=”TableInsert” getContent=”ReloadMenu”/>
</group>

The important attribute here is “getContent”.  This is a callback to a method in the VBA which will create the items for the menu.  The method will literally create xml for a menu from scratch and return it.  Anything that can normally be in a menu can be added this way – including buttons, submenus, and separators.  The sample code below creates a button and a submenu with another button inside it. Continue reading Creating Dynamic Menus in VBA Add-Ins

Comparing Excel Export Functionality in SSRS 2012 to OfficeWriter

In the latest version of SQL Server, SQL Server 2012, Reporting Services now supports the Office 2007\2010 XLSX file format (aka Office Open XML file format) in its Excel renderer. In fact that is the default format for the Excel renderer. The old renderer for the legacy Excel 2003 XLS format has been named to “Excel 2003” but it has been deprecated and is not visible in the available export options list by default. For reference see the related section in the MSDN documentation. Although SSRS 2012 has now the ability to export an RDL report into an Excel XLSX workbook, the Excel renderer still has certain limitations. In this blog post, we will discuss some of these limitations and compare them to the OfficeWriter renderer in SSRS.

Charts

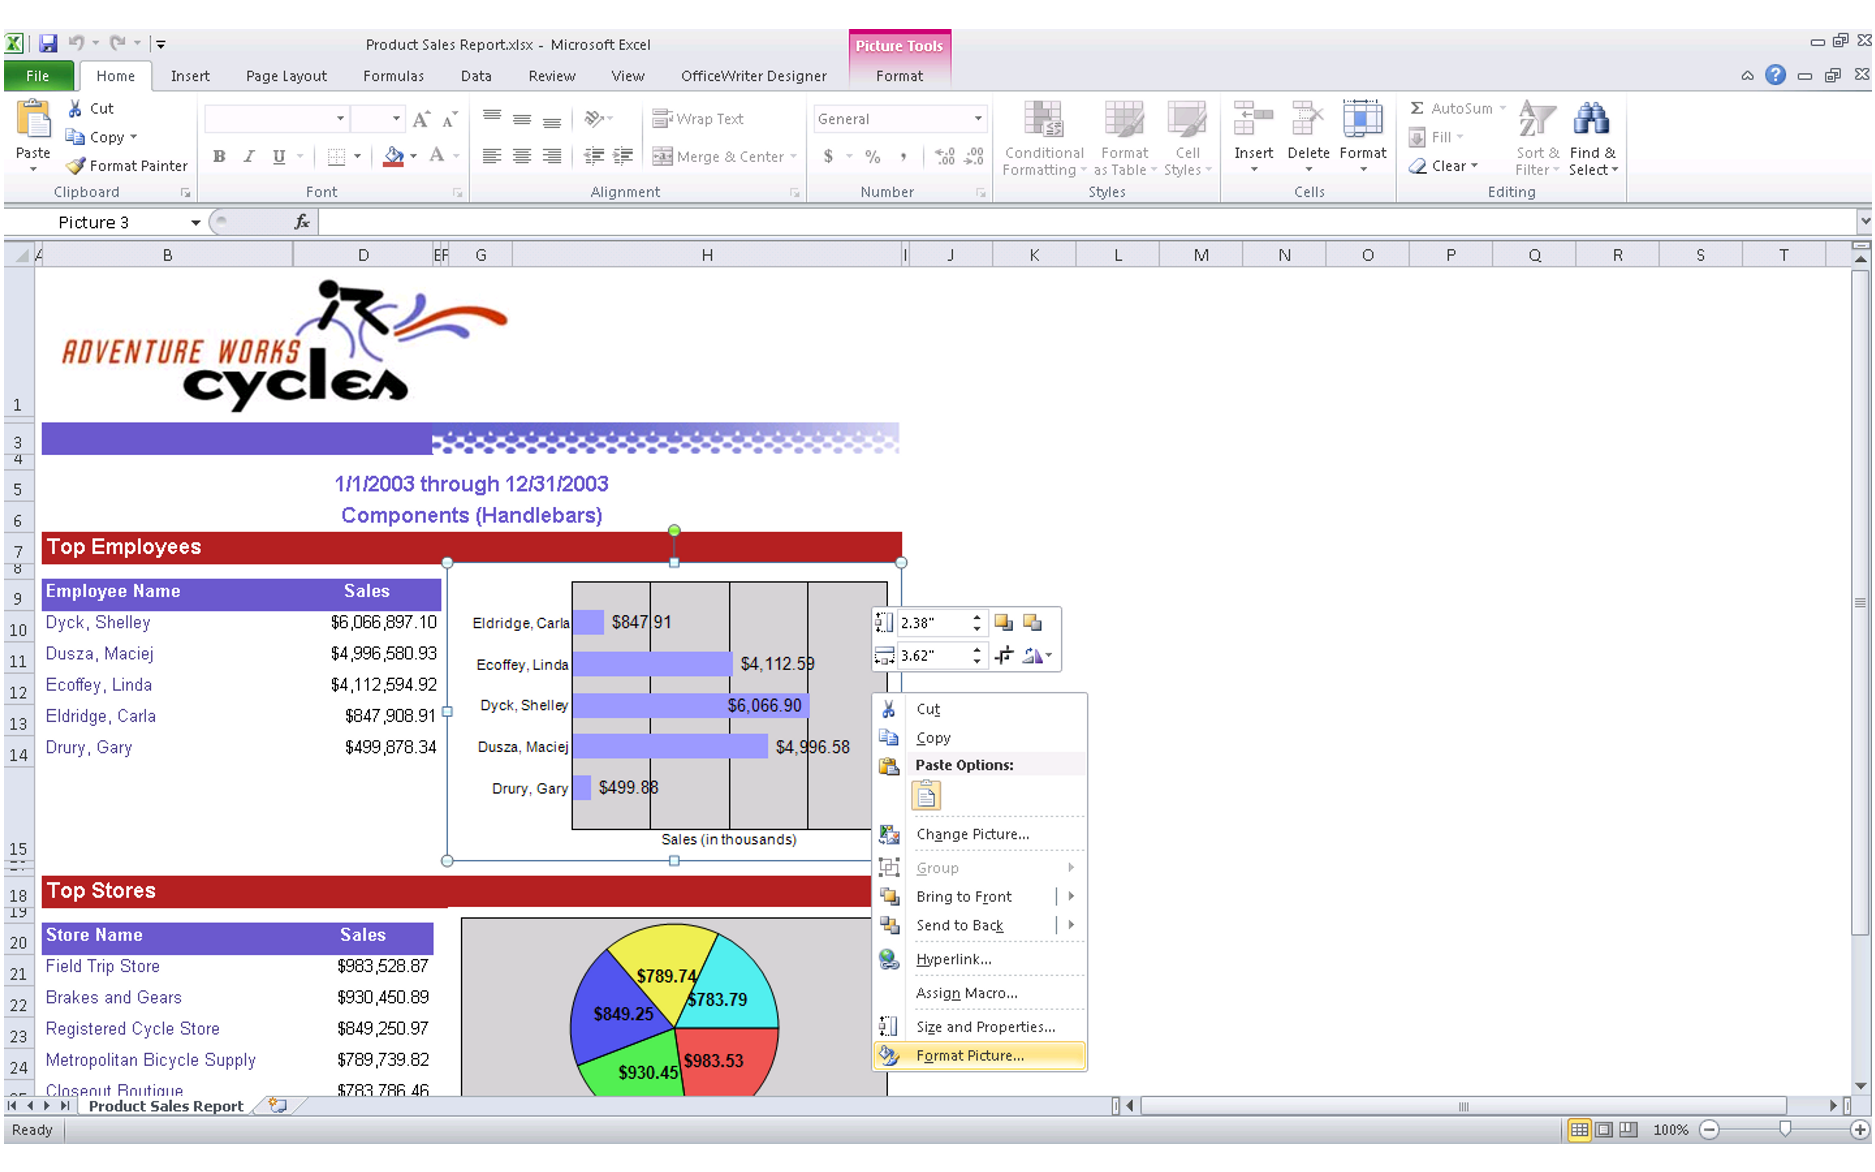
Probably one of the major limitations is that charts will be exported as pictures. In the related section in the MSDN documentation it states:

“Charts, sparklines, data bars, maps, gauges, and indicators are exported as pictures. The data they depict, such as the value and member labels for a chart, is not exported with them and is not available in the Excel workbook unless it is included in a column or row in a data region within a report.”

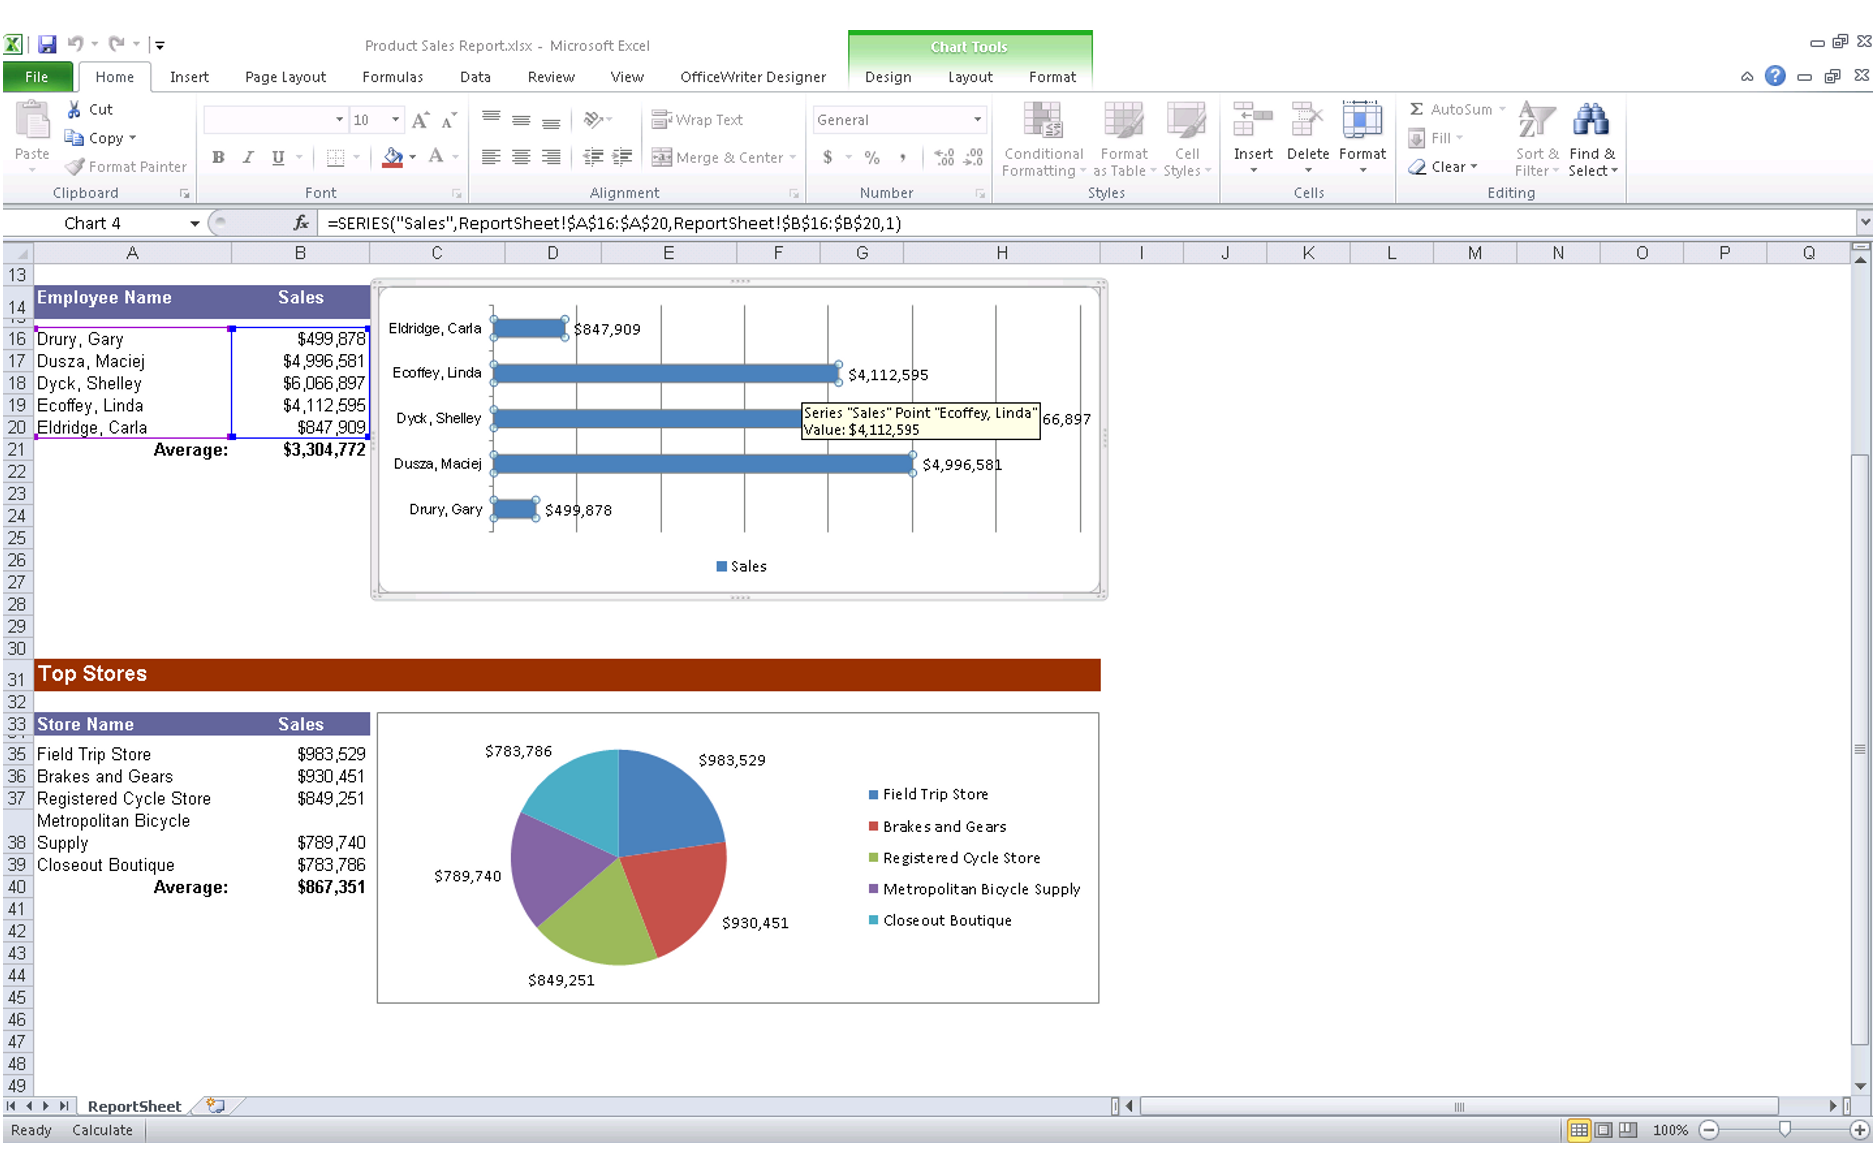
With the OfficeWriter renderer on the other hand, the charts will be native Excel charts with live data. Let’s see the difference in the following screenshots:

“Product Sales Report.xlsx” generated using the SSRS 2012 Excel renderer (note that the chart is a picture)
Continue reading Comparing Excel Export Functionality in SSRS 2012 to OfficeWriter