All posts by elisek

5 PowerPoint Professionals You Should be Following

PowerPoint is not an easy skill to master. Behind every great PowerPoint are hours of design, sweat, and tears. Thankfully, there are bright PowerPoint experts in our midst, here to alleviate any undue stress, caused by that last minute slide update before an important client meeting. Whether you need to learn the techniques for planning a presentation or putting together a well-developed slide deck, these are resources you should have in your back pocket. Below are 5 presentation and PowerPoint experts you should be following, if you’re not already.

1. Geetesh Bajaj – Indezine

Created by Geetesh Bajaj, Indezine is a site dedicated to providing the tools and resources any PowerPoint user needs to execute an effective PowerPoint presentation. Reviews, interviews with professionals in the field, as well as add-in recommendations, Indezine provides a roadmap to getting started with and mastering PowerPoint.

2. Cole Nussbaumer – Storytelling with Data

Storytelling with Data is run by Cole Nussbaumer. Her goal? “To rid the world of ineffective graphs, one exploding pie chart at a time.” With a focus on data visualization, Nussbaumer assists individuals and companies in finding the most effective ways of representing their data. Her underlying principle is that the data should tell a clear story, and she provides tips on just how to make that happen.

3. Nancy Duarte – Duarte Design

If you want to know about presentation design, you need to know Nancy Duarte. Passionate about visual storytelling, Duarte has authored several books, one being Slide:ology: the Art and Science of Creating Great Presentations. You may recognize some of her work on Al Gore’s documentary, An Inconvenient Truth. Follow her on Twitter.  Listen to her TED Talk.

4. Sandra Johnson – PowerPoint Wiz

As a Microsoft PowerPoint MVP, Sandra Johnson brings her 20-year marketing background to assist enterprise companies in creating business-worthy presentations. Focusing on presentation as an art form, Sandra helps her clients communicate their message succinctly.

5. Dave Paradi – Think Outside the Slide

Dave Paradi is the author of 7 PowerPoint presentation books, as well as a consultant on giving an effective PowerPoint presentation. His work has been featured in The Wall Street Journal, and he has worked on prominent presentations, including one used to brief President Obama’s cabinet ministers.  His workshops provide ways in which professionals can communicate their message clearly and effectively, and his site is brimming with free resources to get you started.

[Review] Pinal Dave from SQLAuthority.com

Founder of SQLAuthority.com and developer for Pluralsight, Pinal Dave, reviewed OfficeWriter’s SSRS integration. Below is an excerpt from his blog post. To read the full review click here.

The OfficeWriter API is a .NET library by SoftArtisans that makes it easy for developers to add Excel and Word reporting and document processing to their own applications. OfficeWriter allows users to take data from any data source and turn reports into dynamic, visual presentations. Without requiring Microsoft Office on the server, OfficeWriter is optimized for high-performance, scalable server use. The .NET API integrates with business applications, including those in SSRS and SharePoint.

Why use OfficeWriter’s API with SQL Server Reporting Services (SSRS)? The default rendering extensions for Reporting Services deliver flat, static output. In order to render for multiple extensions such as HTML and PDF, the basic report design in SSRS cannot accommodate specific features, such as multiple worksheets in Excel. This also means that certain features like charts cannot be dynamic in the output because not all of the rendering extensions in SSRS support Excel charts. Therefore, charts are exported as images. Additionally, until SSRS 2008 R2, there wasn’t a default rendering extension for Word. Before SSRS 2012 there was no means of exporting to XLSX or DOCX. Using OfficeWriter for Reporting Services corrects these limitations, allowing end-users to design reports in Excel and Word and make use of many specific features in those applications.

How Creating a Report in SSRS with OfficeWriter Works:

OfficeWriter fits into SSRS with two parts. First, the OfficeWriter Renderer is a server-side rendering extension for Excel and Word, providing Excel and Word features beyond the built-in SSRS export options. Second, the OfficeWriter Designer is a client-side add-in for Excel and Word, which allows users to design reports that utilize the OfficeWriter rendering extensions.

To read the full review click here.

[Press Release] SoftArtisans Expands its Product Offerings with the Addition of PowerPointWriter

FOR IMMEDIATE RELEASE

SoftArtisans Expands its Product Offerings with the Addition of PowerPointWriter

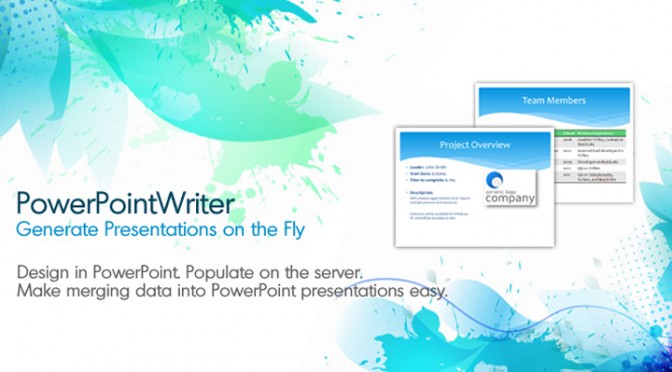
SoftArtisans releases OfficeWriter version 9 and introduces a new tool named PowerPointWriter to their .NET API. PowerPointWriter is a template-based approach to generate dynamic PowerPoint presentations.

WATERTOWN, MA – February 26, 2014 – SoftArtisans, a leading developer of Office-based reporting software, announces the release of their newest product version, OfficeWriter version 9. Alongside their OfficeWriter version 9 release, SoftArtisans introduces a new tool called PowerPointWriter, thereby greatly expanding the product portfolio of their enterprise software.

PowerPointWriter is a template-based approach to generating reports. Unlike other tools on the market, PowerPointWriter uses a template model, making it easy for developers to design their reports within PowerPoint and merge them with data using as little as five lines of code. VP of Development, Sam Haddad, comments, “This has been a request from our customers for some time now. One of the things our customers always tell us is that they love our template-based approach to generating Office documents, and wanted the same ability with PowerPoint. So we did just that.” PowerPointWriter takes advantage of the technology behind Excel and Word’s mail merge feature, to make combining customized templates with company data easier.

Along with PowerPointWriter, SoftArtisans adds major developments to their ExcelWriter tool. The most notable of which, is a calculation engine, providing users the ability to calculate the results of formulas (such as SUM, PRODUCT, AVERAGE, VLOOKUP, etc.) in an Excel workbook through the OfficeWriter API. This allows users to view formula-laden Excel spreadsheets across many devices and viewers.

OfficeWriter has long been the trusted software for building Microsoft Excel and Word reports in .NET, without requiring Microsoft Office to be installed on the server. In addition to legacy binary file formats XLS and DOC, OfficeWriter supports OOXML files. With the addition of PowerPointWriter, SoftArtisans has expanded into PowerPoint file formats, including PPTX. As a trusted part of enterprise applications, OfficeWriter is easier to use than the OpenXML SDK, and, unlike automating Office on the server, is scalable and optimized for use in ASP.NET. The new product version is now available for download through their site at www.officewriter.com.

###

About SoftArtisans
SoftArtisans is a leading developer of Microsoft Office format reporting software. A key Microsoft partner, SoftArtisans delivers award-winning products to over 20,000 clients in more than 70 countries. SoftArtisans also offers a wide range of technical services that enable clients in industries ranging from finance to healthcare to government, to maximize their reporting abilities with OfficeWriter. Headquartered in Watertown, MA, SoftArtisans has been honored as one of North America’s 500 fastest-growing technology companies.

Contact:
Elise Kovi
elisek@softartisans.com

VP of Development Talks PowerPointWriter

[Updated February 26, 2014]

We just launched PowerPointWriter, a new tool to save companies time on generating PowerPoint presentations with their own data, through their own applications. What is it exactly? How does it work? Why would you use it? We asked our VP of Product Development (and PowerPointWriter enthusiast), Sam, to give us a look at what makes this tool something to write home about.

sam_profile

1. What is PowerPointWriter?

PowerPointWriter is a tool that allows developers to combine their data from each of their data sources with PowerPoint files. This means that the PowerPoint files and presentations you generate will always have the most up-to-date data.  Just imagine being able to generate that weekly sales presentation for your boss every Monday morning with the newest data pulled fresh from the database.

2. What has you most excited about launching PowerPointWriter?

This has been a request from our customers for some time now. One of the things our customers always tell us is that they love our template-based approach to generating Office documents, and wanted this same ability with PowerPoint. So we did just that.

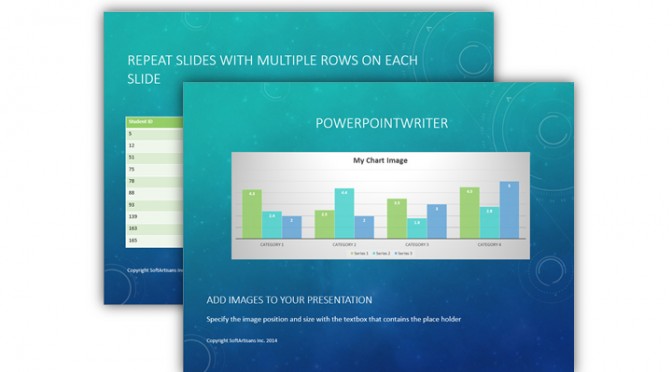
With PowerPointWriter’s template approach you can have things like dynamic images, tables, lists, and slides in as little as 10 lines of code.

3. What is your favorite feature being introduced?

This is definitely our RepeatSlide. Many times you are importing a dynamic set of data and the size will change. With RepeatSlide you can easily create a template file with only one slide in it, and have the slide repeat automatically to accommodate your data. For instance, you might have 100 rows of data and PowerPointWriter will automatically create 10 slides for you. Then, if your data grows to 200 rows, PowerPointWriter will create 20 slides for you automatically, and everything on your slide will be preserved!

4. Can you give us a few scenarios in which customers can use this product?

PowerPointWriter is really good at Mail Merge types of scenarios. For instance:

If you are all business:

Any type of pitch deck would be a great use case. Maybe you want to show your up-to-date sales numbers to stakeholders, management, or investors. You could make Score Reports using PowerPointWriter formulas, or certificates of completion for a course all of your employees were required to take.

If you are all fun:

Maybe you just want to show your mother-in-law photos from that vacation you didn’t invite her to (just kidding, I love my mother-in-law).

Why limit yourself? You can check out the samples page for more ideas.

5. What problems does PowerPointWriter solve?

PowerPointWriter allows you to get your data from virtually any data source, and put it into a file format that is familiar to your users. Continue reading VP of Development Talks PowerPointWriter

Announcing PowerPointWriter Beta

Join the beta

PowerPointWriter, the template-based way to merge your data with PowerPoint presentations, has arrived. Take your company data and merge it with PowerPoint to create custom presentations. We’re looking for beta testers to try out this new technology.

What is PowerPointWriter?

  • PowerPointWriter is a template-based approach to your presentations.
  • It allows you to build presentations programmatically with 5 lines of code.
  • No more add-ins. PowerPointWriter is a server-side solution to your custom presentations.

Learn more by joining the beta. You’ll receive a special reward just for signing up. Still curious? Take a quick look at our overview video!

 and 


Creating Holiday Cards and Other Unexpected OfficeWriter Projects

Last week, our VP of Development Sam and Senior Sales Engineer Chad were challenged to look at different ways to use OfficeWriter. The result? They put together a project designed to keep you in touch with your friends and family this holiday season. They looked at using OfficeWriter’s mail merge feature in a new way. Plus, they took that one step further, looking at how the technologies from this project can be applied to business applications within your company. Before heading home for the holidays, take a little inspiration from this behind-the-scenes video of unexpected ways to use OfficeWriter in building your reports and company documents.

Read the original post, get the code, and take a behind-the-scenes tour of the technologies it runs on.

Embedly Powered

via Vimeo

Want to get straight to the point? Skip to the end of the video to discover how this project could be applied to your business.

How I Learned to Love My Data: Gobbles and Gobbles of Data

Love your dataLet me preface this by saying I am a communications major, a lover of language and all things related to the humanities, following the auspices of the left brain. Science, statistics, numbers, data – that was for my logically-minded friends. Attending a research university, I was constantly surrounded by studies, which as you guessed it, are based off of piles and piles of data. It’s not that I didn’t understand the importance of data, it’s that I just never loved it. As a communications major I tended to shy away from numbers. (Okay, more like run flailing in the opposite direction as though my life depended on it.) Turns out numbers are a very real part of marketing, if not the crux of every marketing campaign. It allows you to measure what is working for your goals and what needs adjustment.

Generally speaking, I love the insights it gives, the conclusions it reaches. I just don’t enjoy the process of data collection in order to reach those conclusions. But who does? With data tied to many different sources, and housed in varying formats, it’s not easy to make it come together in one simple report. I’d like my data handed to me, preferably on a silver platter. Yes, well, that’s not how it works. And that’s not how it should work. In order to really understand the insights and not be misled by false assumptions, you should be able to understand where this data is coming from, how things are being measured, and what the goals are behind it.

Working at a software company, whose product deals with a ton of data and is designed for companies processing it to perform their reporting, I’ve had to become more comfortable with it. In any job this is a valuable skill to possess. Being able to deliver reports and present your work and results to the company/client/manager is a very necessary part of any business, and one that CEOs and execs place a lot of stake in. Not only that, it puts a tangible number to your work you can point to, to assess improvements and successes.

While there is this necessary business side to data collection, that doesn’t have quite the same motivation to learning to fully appreciate it. As I dove deeper into the weeds – spreadsheets, SSRS, Big Data, dark data, and servers – I discovered the ways in which people were using these numbers, the artful approach to using and displaying the information that is being collected. My coworkers showed me spreadsheets can be the springboard for masterpieces (see: Baking Cookies in Excel and Making Art with Excel). Speaker and data visualization blogger, Cole Nausbaumer, showed me you can infuse creativity into numbers. In her Storytelling with Data blog, she shows the meshing of the creativity behind presenting your data in a way people can relate to and process it: the age old art of storytelling. Now that is something to which I can relate. (If you haven’t yet, you should read her blog, and pick up tricks on data visualization.)

Along the same lines of displaying your data, Continue reading How I Learned to Love My Data: Gobbles and Gobbles of Data

Troubleshooting Tools to Give Thanks to this Thanksgiving

thanskgiving

[Once a week I snoop around the office, bothering my coworkers with questions on what they’re reading, listening to, consuming, or any other random inquiries I’d like to subject them to. Sometimes they even respond.]

Debug, de-stress. This week we’re giving thanks to these troubleshooting tools that keep us sane. We chose troubleshooting tools not for the alliteration value (though, that was a happy coincidence), but to find time-saving ways you can stay on top of your coding projects this holiday season. See below as we show our appreciation for developer tools we can’t live without. What other tools do you use to debug and de-stress? Tell us about them in the comments section below.

Chad, Sr. Sales Engineer

Fiddler2 helps make debugging web service calls easy.

Paula, Director of HR

Don’t even need to think about that one – System Restore Manager!

Ozgur, Development

I’d definitely list Fiddler and WireShark as some of the top troubleshooting tools that I am thankful for.

Aviva, VP of Technical Services

I mostly use the debugger in Visual Studio or custom code I write myself. Although it’s not a development tool, Procmon can be helpful, for monitoring activities on the filesystem and registry.

Stephanie, Technical Services

Total Commander is great. The program does a ton of stuff, but I really like its Continue reading Troubleshooting Tools to Give Thanks to this Thanksgiving

RetroTech Vol 1: Yuri Broze, Datasciencehead at Nomi

[Welcome to RetroTech, a joint blog series with Skimbox, where we journey back in time to an era of floppy disks, the Atari 800, and that unmistakable clicking sound of dial-up. We’re digging up the good ol’ days with interviews from tech’s most staunch patrons and giving you a glimpse of their technological firsts.]

Interviews with TechFrom Proust and his madeleines to Buzzfeed and early Britney, if there’s one thing that unites us, it’s our shared affection for nostalgia. And tech nostalgia is, at least in our opinion, a particularly rich strain, because it combines memories with cluck-tongued humor. So we decided to mine it with RetroTech, an interview series about personal technological firsts.

To kick of the series, we turned to Yuri Broze. Yuri is a number of things, including: maestro of the right and left brains, unicyclist, pianist, and world-class whistler. He may not be the only data scientist with a PhD in Music Psychology, but he is the only one we know.

First screen name: dkcrulz. Short for “Donkey Kong Country Rules.” Yuri picked it up at age 11, in 1994, right after Donkey Kong Country came out.

First email address: dkcrulz@aol.com.

First computer: An IBM Compatible running MS DOS. “I would write poetry on it and have every other line come back ‘bad command or file name.’”

First video/computer game: Lemonade Stand for Apple 2. (Ed — this looks like the least fun computer game ever, and I say that as a person who wrote an execrable version of Pong.) Continue reading RetroTech Vol 1: Yuri Broze, Datasciencehead at Nomi

Weekend Reading: What You Should Be Reading this Weekend

Credit: HubSpotNews that should be taking up space on your online reader, Kindle, iPad, or other miscellaneous gadgetry.

Data, Data, Data
Public Health: How Does the UK Compare with Europe? Interactive Map
Source: The Guardian
The Guardian‘s Data Blog produces interactive maps and images to visualize interesting data sets. This week they tackled life expectancies and overall health in the UK relative to Europe.

Gadgets
A Gestural Interface for Smart Watches
Source: MIT Technology Review
Researchers at the University of California at Berkeley and the University of California at Davis are developing a tiny chip that detects gestures in 3D. The chip is called Chirp, and its goal is to bring gesture controls to an array of devices, including wearable technology such as smart watches.

Startups
Circle Raises $9 Million Series A from Accel and General Catalyst to Make Bitcoins Mainstream
Source: TechCrunch 
Will Bitcoins make it after all? Circle, a Boston-based company, is a platform designed to make trading Bitcoin and other digital currencies easier. This is among the highest Series A funding received by startups in the digital currency space so far. See who invested and what this means for the company.

Events
One Million Kids Have Signed Up for the Hour of Code. Let the Geeking Out Commence.
Source: PandoDaily
Mark your calendars for December 9th – 15th, as the week of Computer Science Education begins. During that time, Continue reading Weekend Reading: What You Should Be Reading this Weekend