Tag Archives: Big Data

How I Learned to Love My Data: Gobbles and Gobbles of Data

Love your dataLet me preface this by saying I am a communications major, a lover of language and all things related to the humanities, following the auspices of the left brain. Science, statistics, numbers, data – that was for my logically-minded friends. Attending a research university, I was constantly surrounded by studies, which as you guessed it, are based off of piles and piles of data. It’s not that I didn’t understand the importance of data, it’s that I just never loved it. As a communications major I tended to shy away from numbers. (Okay, more like run flailing in the opposite direction as though my life depended on it.) Turns out numbers are a very real part of marketing, if not the crux of every marketing campaign. It allows you to measure what is working for your goals and what needs adjustment.

Generally speaking, I love the insights it gives, the conclusions it reaches. I just don’t enjoy the process of data collection in order to reach those conclusions. But who does? With data tied to many different sources, and housed in varying formats, it’s not easy to make it come together in one simple report. I’d like my data handed to me, preferably on a silver platter. Yes, well, that’s not how it works. And that’s not how it should work. In order to really understand the insights and not be misled by false assumptions, you should be able to understand where this data is coming from, how things are being measured, and what the goals are behind it.

Working at a software company, whose product deals with a ton of data and is designed for companies processing it to perform their reporting, I’ve had to become more comfortable with it. In any job this is a valuable skill to possess. Being able to deliver reports and present your work and results to the company/client/manager is a very necessary part of any business, and one that CEOs and execs place a lot of stake in. Not only that, it puts a tangible number to your work you can point to, to assess improvements and successes.

While there is this necessary business side to data collection, that doesn’t have quite the same motivation to learning to fully appreciate it. As I dove deeper into the weeds – spreadsheets, SSRS, Big Data, dark data, and servers – I discovered the ways in which people were using these numbers, the artful approach to using and displaying the information that is being collected. My coworkers showed me spreadsheets can be the springboard for masterpieces (see: Baking Cookies in Excel and Making Art with Excel). Speaker and data visualization blogger, Cole Nausbaumer, showed me you can infuse creativity into numbers. In her Storytelling with Data blog, she shows the meshing of the creativity behind presenting your data in a way people can relate to and process it: the age old art of storytelling. Now that is something to which I can relate. (If you haven’t yet, you should read her blog, and pick up tricks on data visualization.)

Along the same lines of displaying your data, Continue reading How I Learned to Love My Data: Gobbles and Gobbles of Data

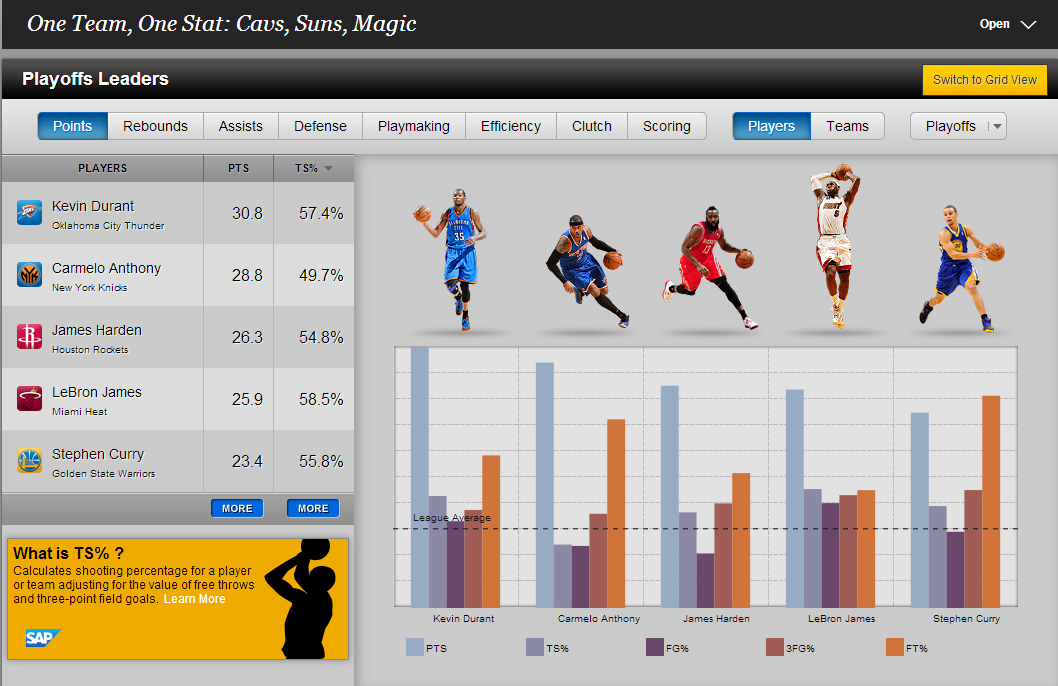
Creative ways companies are making use of Big Data

From art to cancer patient care, consumer goods to the NBA, Big Data is piling up and these companies are finding ways to make sense of it all. Scroll through the slideshow below to find out how.

Through the above examples of striking visualizations to interactive user experiences, we’re seeing companies and individuals find unique ways to leverage the data and insights being collected daily. How are you seeing Big Data used within your industry? Do you have any examples? Let us know!

Continue reading Creative ways companies are making use of Big Data

Quantify Me: The Rise of Self-Tracking

Credit: Syncstrength.com

“Have you heard of the quantified self?” my coworker asked me.  After a puzzled stare and a furrowed brow I assured her I hadn’t. So of course I immediately clicked over to a new tab and typed “quantified self” in the browser. Turns out I had heard of this concept, I’d just never put a name to it. In fact, I’d been partaking in this movement for years – tracking my whereabouts with Foursquare, logging my calorie intake with MyFitnessPal and recording my workouts with RunKeeper. I even had a stint with Saga, the app that tracked your every single move without you having to do anything! Just install the app and let ‘er rip.

There are a ton of apps and wearable devices dedicated solely to this purpose of tracking and quantifying oneself, all with the ideal goal of finding correlations and being able to improve upon your productivity, fitness, and overall well-being. The Zeo monitor straps to your head, monitors your sleep cycles, and comes equipped with a programmable alarm clock that wakes you at the optimal phase of sleep. Adidas has a chip called miCoach you place in your shoe and it will record your speed, subsequently breaking down your recorded data graphically on their website. Samsung hopped on this trend and partnered with Foursquare to visually capture your whereabouts with their Foursquare Time Machine. Of course curiosity got the better of me and I gladly gave them access to my Foursquare check-ins. Take all of my data, Samsung! Link all of my accounts? Suuure. The more the merrier. Just remember to spit back a cool interactive image so I can see all of my data.

I’m not alone in my curiosity. It was reported last year that wearable monitoring devices raked in an estimated $800 million in sales. And it doesn’t stop there. IMS Research projects that the wearable technology market will exceed $6 billion by 2016. People are buying into this self-tracking movement. So why the obsession?

Continue reading Quantify Me: The Rise of Self-Tracking

Welcome Back, Privacy Concerns: Big Data, Healthcare, and PRISM

Photo Credit: Mashable.com

I suppose I shouldn’t say, “Welcome back, privacy concerns,” as I’m sure they never left, just quietly assumed their position humming in the background and shadows of the internet noise. This week, however, they took center stage both in the healthcare space and in government news.

This week, The New York Times published an article on a significant announcement for the healthcare industry. A group of global partners spanning 41 countries and including 70 medical, research and advocacy organizations agreed to share a heap of genetic data. “Their aim is to put the vast and growing trove of data on genetic variations and health into databases that would open to researchers and doctors all over the world, not just to those who created them,” The New York Times wrote. Currently, research labs and facilities are very much siloed. Each institution has their own research within their own walls and with their own records and system of operations. There is no universal method for representing and sharing genetic data, which could lead to advanced findings in cures and other health-related research.

One reason for the lack of a central system is the sheer volume of data. There is just too much information being produced by the minute. Not only that, but it is often unstructured and not of quality (meaning information was entered or gathered incorrectly/differently, such as January being entered in as Jan, 1, 01, or January, making it difficult to analyze). While volume and quality of data is an issue, the overarching problem, or rather challenge, healthcare professionals face lies mostly in the security space. With all of that sensitive patient data, there need to be strict, infallible measures to protect that information. Along those same lines is the question of who will have access to that information.

This is especially significant as it comes at the same time of privacy concerns regarding the NSA’s reported access to granular consumer data. Continue reading Welcome Back, Privacy Concerns: Big Data, Healthcare, and PRISM

Big Data and OfficeWriter

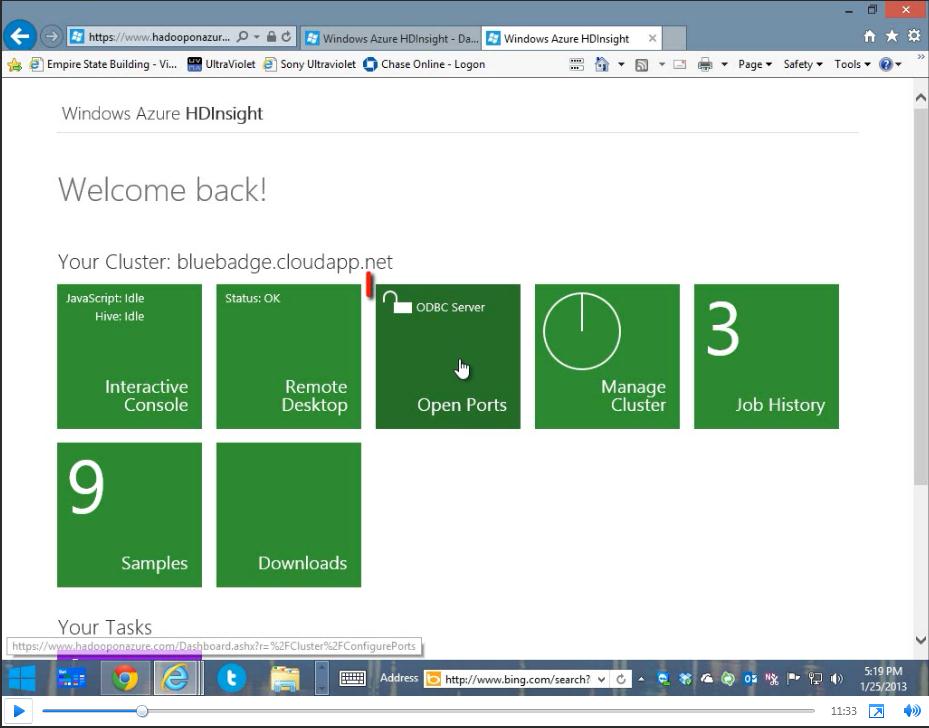
Big Data DemosWe partnered with Andrew Brust from Blue Badge Insights to integrate OfficeWriter with Hadoop and Big Data. Taking existing OfficeWriter sample projects, Andrew discusses how he created two demos showing OfficeWriter’s capabilities to work with Big Data. One demo uses C#-based MapReduce code to perform text-mining of Word docs. The other demo focuses on connecting to Hadoop through Hive.

In these demos you will learn:

  • How OfficeWriter integrates with Hadoop and Big Data
  • How to use ExcelWriter with Hadoop


Big Data for Dummies. Big Daddy for Geniuses.

[The following is a guest post from our partner company Riparian Data and new intern and data-ist Brennan Full. Happy to have you on board, Brennan!]

I first heard the words “big data” while listening to the radio at the gym, the host’s voice guiding me over the precipice of a “hill” on my humming elliptical.  The words immediately brought me back to my “Sandler period” where Big Daddy was watched on repeat until one had reached comedic enlightenment.  It wasn’t until the 3rd mention of “zettabytes” that I finally came around and realized that this conversation was concerning the mountains of data humans create every day.  Disappointed, I changed the station. Months later, looking for marketing opportunities I came across an opening at Riparian Data, a company that works with “big data”.   Again, the flashbacks returned; Scuba Steve, tripping people in Central Park, teaching Rob Schneider how to read… I have got to find a way to work there!

Before my interview I began researching the company, shocked to find out that I was horribly mistaken/illiterate and that Riparian Data in fact had nothing to do with the magnum opus of my childhood.  I sat for hours, researching, working desperately to understand what this emerging technological field was all about.  Hours passed and I was no closer to grasping NoSQL.  Dejected, I turned to my worn copy of Big Daddy.  As I slowly descended into a meditative state it hit me, BIG DATA AND BIG DADDY AREN’T COMPLETELY DISSIMILAR!

You see, much like shapeless masses of data, Sandler’s character lacks purpose, that is until someone comes around and gives the data/“daddy” meaning.  Big data is the collection and analysis of the information we’re all constantly generating as we text, tweet, buy things, use GPS, etc.  This incomprehensible mountain of information would lack significance if not for the tools brought about by big data.  This, ladies and gentlemen is how my warped mind came to understand what big data is all about.

Thanks for having me on board Riparian Daddy!

NOTES: I never went through a Sandler period, I never use an elliptical, and I’m fairly certain Rob Schneider was acting like he couldn’t read.

Stories from the WIT Trenches: Abby Fichtner

[This is the ninth in a series of posts exploring the personal stories of real women in technology. Every woman in tech overcame, at the very least, statistical odds to be here; this blog series aims to find out why, and what they found along the way. This time around we chatted with Abby Fichtner (t|ln), better known as Hacker Chick for her devoted work with Boston startups. Recently named Founding Executive Director of hack/reduce, a non-profit big data hacker space, Abby is in constant search of shaking up conventional wisdom and finding out what lies beyond. If reading her story inspires you to share yours, please feel free to email me.]

Hi! I’m Abby Fichtner – although more people probably know me as Hacker Chick. I write The Hacker Chick Blog on how we can push the edge on what’s possible, and I’m about to launch a non-profit hacker space for big data called hack/reduce.

Prior to this, I was Microsoft’s Evangelist for Startups where I had the most incredible experience of working with hundreds of startups. I’ve been alternately called the cheerleader and the guardian angel for Boston startups. I love this community and am super excited to launch hack/reduce to help Boston continue solving the really hard problems and keep our title as the most innovative city in the world.

Questions:

1. Can you take us back to your “eureka!” moment—a particular instance or event that got you interested in technology?

I like to joke that programming is in my blood.  My Dad has been programming since the 1960’s and my brother followed him into Computer Science. So when we were kids, my parents told us that whoever made the honor roll first would get an Atari. This was 1980 and so Atari game machines were The Thing to have.

Sufficiently motivated, I made the honor roll and my Dad came through – with an Atari 800, the PC!  Pretty much nobody had PCs in 1980, so this was pretty elite. For games, we got these Atari magazines that had pages and pages of source code in them and our father-daughter bonding experiences were typing in the machine language to build our own games. Talk about hard core, right?!

2. Growing up, did you have any preconceived perceptions of the tech world and the kinds of people who lived in it?

Growing up I did not want to be a programmer! I thought that was something my Dad and my brother did. I was an independent woman and going to follow my own path. I heard that if you’re really good, they make you a manager. So my goal was to be on the business side of things. Continue reading Stories from the WIT Trenches: Abby Fichtner

Boston’s Big Datascape, Part 1

[Excerpted from the Riparian Data blog]
Big Data, or the technologies, languages, databases and platforms used to efficiently store, analyze and extract conclusions from massive data sets, is a Big Trend right now. Why? In a nutshell, because a) we are generating ever increasing amounts of data, and b) we keep learning faster, easier and more accurate ways of handling and extracting business value from it. On Wall Street, some investment banks and hedgefunds are incorporating sentiment analysis of web documents into their trading strategies. In healthcare, companies like WellPoint, Explorys and Apixio are using distributed computing to mine health records, practice guidelines, studies and medical/service costs to more accurately and affordably insure, diagnose and treat patients.

Unsurprisingly, Silicon Valley is big data’s epicenter, but Boston, long a bastion of Life Sciences, Healthcare, High Tech and Higher Ed, is becoming an important player, particularly in the storage and analytics arenas. This series aims to spotlight some of the current and future game changers. These companies differ in growth stages, target markets and revenue models, but converge around their belief that the data is the castle, and their tools the keys.

1)      Recorded Future

  • Product: Recorded Future is an API that scans, analyzes and visualizes the sentiment and momentum of specified references in publically available web documents (news sites, blogs, govt. sites, social media sites etc)
  • Founder/CEO: Christopher Ahlberg
  • Technologies used: JSON, real-time data feeds, predictive modeling, sentiment analysis
  • Target Industries: Financial Services, Competitive Intelligence, Defense Intelligence
  • Located: Cambridge, MA

2)      Hadapt

  • Product: The Hadapt Adaptive Analytical Platform is a single system for processing, querying and analyzing both structured and unstructured data. The platform doesn’t need connectors, and supports SQL queries.
  • Founders: Justin Borgman (CEO); Dr. Daniel Abadi (Chief Scientist)
  •  Technologies used: Hadoop, SQL, Adaptive Query Execution™
  • Target Industries: Financial Services, Healthcare, Telecom, Government

[Read the full post]

Combiners: The Optional Step to MapReduce

Most of us know that hadoop mapreduce is made up of mappers and reducers. A map task runs on a task tracker. Then all the data for each key is collected from all the mappers and sent to another task tracker for reducing, one reduce task per key. But what slightly less than most of us know about are combiners. Combiners are an optimization that can occur after mapping but before the data is segregated to other machines based on key. Combiners often perform the exact same function as reducers, but only on the subset of data created on one mapper. This allows the task tracker an opportunity to reduce the size of the intermediate data it must send along to the reducers.

For instance, if we take the ubiquitous word count example. Two mappers may produce results like this:

Mapper A Mapper B
X - 1
Y - 1
Z - 1
X - 1
X - 1
X - 1
Z - 1
Y - 1
Y - 1

All those key-value pairs will need to passed to the reducers to tabulate the values. But suppose the reducer is also used as a combiner (which is quite often the case) and suppose it gets called on both results before they’re passed along:

Mapper A Mapper B
X - 2
Y - 1
Z - 1
X - 2
Z - 1
Y - 2

The traffic load has been reduced. Now all that’s left to do is call the reducers on the keys across all map results to produce:

X - 4
Z - 2
Y - 3

An important point to keep in mind is that the combiner is not always called, even when you assign one. The mapper will generally only call the combiner if the intermediate it’s producing is getting large, perhaps to the point that it must be written to disk before it can be sent. That’s why it’s important to make sure that the combiner does not change the inherit form of the data it processes. It must produce the same sort of content that it reads in. In the above example, the combiners read (word – sum) pairs and wrote out (word – sum) pairs.

image via: wpclipart.com