Category Archives: Big Data

OfficeWriter and the Microsoft Application Platform

Curious to know more about how OfficeWriter fits in with the Microsoft Application Platform? We’ve partnered with Andrew Brust from Blue Badge Insights to bring you an overview of the additive value OfficeWriter provides to the Microsoft stack.

In this powerpoint:

  • You’ll learn about OfficeWriter’s object and template models
  • Scenerios in which to use OfficeWriter
  • How OfficeWriter plays into Microsoft Dynamics, SharePoint, and Azure


Stories from the WIT Trenches: Abby Fichtner

[This is the ninth in a series of posts exploring the personal stories of real women in technology. Every woman in tech overcame, at the very least, statistical odds to be here; this blog series aims to find out why, and what they found along the way. This time around we chatted with Abby Fichtner (t|ln), better known as Hacker Chick for her devoted work with Boston startups. Recently named Founding Executive Director of hack/reduce, a non-profit big data hacker space, Abby is in constant search of shaking up conventional wisdom and finding out what lies beyond. If reading her story inspires you to share yours, please feel free to email me.]

Hi! I’m Abby Fichtner – although more people probably know me as Hacker Chick. I write The Hacker Chick Blog on how we can push the edge on what’s possible, and I’m about to launch a non-profit hacker space for big data called hack/reduce.

Prior to this, I was Microsoft’s Evangelist for Startups where I had the most incredible experience of working with hundreds of startups. I’ve been alternately called the cheerleader and the guardian angel for Boston startups. I love this community and am super excited to launch hack/reduce to help Boston continue solving the really hard problems and keep our title as the most innovative city in the world.

Questions:

1. Can you take us back to your “eureka!” moment—a particular instance or event that got you interested in technology?

I like to joke that programming is in my blood.  My Dad has been programming since the 1960’s and my brother followed him into Computer Science. So when we were kids, my parents told us that whoever made the honor roll first would get an Atari. This was 1980 and so Atari game machines were The Thing to have.

Sufficiently motivated, I made the honor roll and my Dad came through – with an Atari 800, the PC!  Pretty much nobody had PCs in 1980, so this was pretty elite. For games, we got these Atari magazines that had pages and pages of source code in them and our father-daughter bonding experiences were typing in the machine language to build our own games. Talk about hard core, right?!

2. Growing up, did you have any preconceived perceptions of the tech world and the kinds of people who lived in it?

Growing up I did not want to be a programmer! I thought that was something my Dad and my brother did. I was an independent woman and going to follow my own path. I heard that if you’re really good, they make you a manager. So my goal was to be on the business side of things. Continue reading Stories from the WIT Trenches: Abby Fichtner

Boston’s Big Datascape, Part 3: StreamBase, Attivio, InsightSquared, Paradigm4, Localytics


[Excerpted from the Riparian Data blog]

This ongoing series examines some of the key, exciting players in Boston’s emerging Big Data arena. The companies I’m highlighting differ in growth stages, target markets and revenue models, but converge around their belief that the data is the castle, and their tools the keys. You can read about the first ten companies here and here.

11) StreamBase

  • Products: StreamBase Complex Event Processing Platform lets you build applications for analyzing real-time streaming data alongside historical data. StreamBase LiveView adds an in-memory data warehouse and a BI front-end to the equation, essentially giving you live (well, a few milliseconds behind) BI.
  • Founder: Richard Tibbetts (t |ln), Michael Stonebraker
  • Technologies used: Complex Event Processing, StreamSQL, cloud storage, pattern-matching, in-memory data warehouse, end-user query interface
  • Target Industries: Capital Markets, Intelligence and Security, MMO, Internet and Mobile Commerce, Telecomunications and Networking
  • Location: Lexington, MA

[read the full post at the Riparian Data blog]

Latent Text Algorithms

The basic idea behind this kind of analysis is that there are certain latent topics in a body of text. Some words like car and automobile have a very similar meaning which means they are used in similar contexts. There is a lot of redundancy in language, and with enough effort you can group similar words together into topics.

Math behind the idea

Words are represented as vectors (see vector space model), which are a combination of direction and magnitude. Each word starts out pointing to its own dimension with magnitude 1, which means there is a huge number of dimensions (maybe hundreds of thousands, one for every word that comes up in the data set you’re working on). The basic problem is to flatten these large number of dimensions into a smaller number which are easier to manage and understand.

These vectors are represented as a matrix. In linear algebra, there is the idea of a basis, which is the set of vectors that describe the space you’re working in. For example, in everyday 3D space your basis would have one vector pointing in each dimension.

For another example, you could have a basis which is two vectors that describe a 2D plane. This space can be described in 3 dimensions, like how a piece of paper exists in the real world. But if all you’re dealing with is a 2D plane, you’re wasting a lot of effort and dealing with a lot of noise doing calculations for a 3D space.

Essentially, algorithms that do latent analysis attempt to flatten the really large space of all possible words into a smaller space of topics.

A fairly good explanation of the math involved is in the ‘Skillicorn – Understanding Complex Datasets‘ book, in chapters 2 and 3.

For a Mahout example, see Setting up Mahout. There are also examples in the examples/bin directory for topic modelling and clustering.

Latent Semantic Indexing example

Mahout doesn’t currently support this algorithm. Maybe because it was patented until recently? Hard to parallelize? In any case, there’s a Java library called SemanticVectors which makes use of it to enhance your Lucene search.

Note: I think there’s a technical distinction between topic modelling and LSI, but I’m not sure what it is. The ideas are similar, in any case

It’s just a JAR so you just need to add it to CLASSPATH. However, you need to also install Lucene and have it in your CLASSPATH (both lucene-demo and lucene-core jars.)

  • Index the Enron data (or some other directory tree of text files) into Lucene:  java org.apache.lucene.demo.IndexFiles -index PATH_TO_LUCENE_INDEX -docs PATH_TO_ENRON_DOCS
  • Create LSI term frequency vectors from that Lucene data (I think this took a while, but I did it overnight so I’m not sure): java pitt.search.semanticvectors.BuildIndex PATH_TO_LUCENE_INDEX 
  • Search the LSI index. There are different searchtypes, I did ‘sum’, the default: java pitt.search.semanticvectors.Search fraud

Here’s my result:

The input is fairly dirty. Mail headers are not stripped out and some emails are arbitrarily cut up at the 80th column (which may explain ‘rivatives’ at the bottom instead of ‘derivatives’). Still, it can be pretty useful

New England Database Summit 2012: Too Big to Flail?


[Image via John Hugg]

Overview

This year’s New England Database Summit was held in the Stata Center at MIT.  If you haven’t been there, it’s a pretty neat building, with some rather odd architecture. I’d say the conference attendees were 70% academic, primarily researchers and professors from MIT, Brown, the University of Wisconsin-Madison, a little bit of Northeastern and Harvard. The other 30% were businesses—I spotted people from Hadapt, Novartis, Endeca, IBM, VoltDB,and TokuTek. Facebook’s head MySQL guy, Mark Callaghan, was there to give one of the keynotes. Microsoft and EMC were the sponsors, and a bunch of  lectures came from Dave DeWitt’s U-Wisconsin/Jim Gray Systems Lab crew . About half of the talks concerned NoSQL and Hadoop, while the other half were for traditional databases (mostly MySQL) with a smattering of hardware in between. Overall I found it enlightening to see what may be coming down the pipeline.

Keynote – Johannes Gehrke (Cornell) on Declarative Data Driven Coordination

The heart of this talk was a set of extensions to SQL that basically allows one to make an “entangled query.” An example entangled query might be “what are the set of classes I can take, which will all have one friend of mine in them.” As one’s set of classes depends upon others’ sets, the queries to determine the sets are said to be entangled. Other examples given were for MMO raid scheduling, wedding gift registries (“what are the set of gifts not yet purchased”), booking plane tickets with conditions (“What are the sets of flights that go from New York to Boston in the morning, on JetBlue, and I want to sit next to Larry Page”). The system was still trying to keep ACID, although due to not being able to really resolve anything until the other side makes a choice, it’s really eventually consistent. The flip side of these queries were entangled transactions. Rather than booking a specific flight or seat one might just book whatever is “best” in the set from an entangled query. One wouldn’t actually know what was booked until later. Guaranteed booking in case one gets an empty set was actually a piece of future work, which was a little surprising. It looks to me like this could be very interesting and helpful, but it still has some kinks that need to be worked out. External constraints are a hugely limiting factor, and multiple nested constraints (A will only sit with B, who won’t sit with C, who will only sit with A) make the entire thing very difficult to solve or it will fall apart in short order. At least one person asked about this in a roundabout way, and didn’t get a satisfactory answer.

Session 1 – Daniel Bruckner (MIT) on Curating Data at Scale: The Data Tamer System

This session was about a mostly automated process for cleaning up raw web data and putting it into proper columns for querying. I have a little bit of experience with this, and didn’t see anything that was particularly revolutionary. The case study used was goby.com, which uses this technique under the hood. Basically, web spiders using regular expressions can mass scrape sites to collect pieces of data, like the price of admission, where this is, what it’s called, when is it open, contact info, etc. This raw data can  then be sorted and attached to a specific thing (with goby a thing is an event or place). Piece of technology I found rather neat was that they don’t necessarily preset the schema of what properties a thing has, instead adding them as new ones appear. It wasn’t clear to me that this was automated, but their UI for managing the data was pretty slick. The “mostly automated” part came up at the end of the talk, where it was revealed that 10 to 20% of the data needs to be manually filtered by an analyst, which isn’t surprising when dealing with messy data.

Session 2 – Willis Lang (U-Wisconsin) on Energy-Conscious Data Management Systems

This was a mostly academic talk. Basically, no one is really looking at the trade-offs between power and performance  in software. It was shown that a certain set of techniques, like specific map/reduce tasks, certain searches, etc. might not be as performant but will reach a specific required performance while using less power. Much of the session was spent detailing the actual experiments done to show this. The power savings chosen for a rather arbitrary performance level came out to about 12%.

Session 3 – Jeong-Hyon Hwang (SUNY Albany) on G* – A Parallel System for Efficiently Managing Large Graphs

This was another academic talk, but the premise was rather interesting if it ever comes to fruition. G* is a  graph API for managing graph data that runs efficiently on Hadoop. It is scheduled for release August 2012, and will be open source. There is not currently a way to test it, and its end performance and stability is unknown but for those with a need to analyze graph data, G* could prove very helpful.

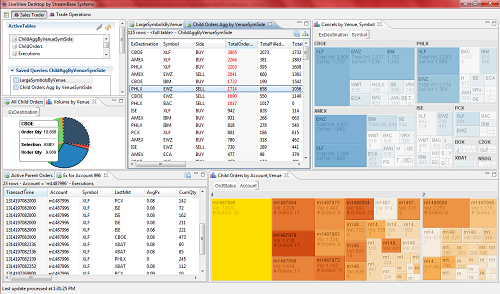
Session 3 – Richard Tibbetts (StreamBase) on StreamBase LiveView

This was a business/marketing session. LiveView is a pretty compelling product. They are capable of continuously streaming live data (financial feeds, mostly) into constantly updated views that have been designed by user analysts. As changes happen in the streaming data, the actual data view and results a user sees are changed before their eyes. Currently, LiveView is in production with a few unnamed large financial firms. Some random  performance targets given out were that they can handle 50k updates/sec, with 100ms propagation time to the end user. I specifically asked if this was a target or if they were actually meeting these numbers, and they claimed to be “destroying them.” Future work includes dealing with messier data, more events and alerting for data changes, and incorporating more pre-built analytics (possibly from other organizations).

Session 5 – David Karger (MIT) on Documents with Databases Inside Them

This was a purely academic talk with a neat premise. Dido consists of an entire data viewer application with attached data, and a WYSIWYG editor for the data viewer, which are appended to an html document. Essentially, this turns the document into a web application, but it doesn’t need any sort of network connection as all the functionality is captured locally in the document. If a user wanted to make a new application, all he/she needs to do is copy the file, and possibly change the underlying data set. This came with an argument against cloud computing – instead of running an application on the cloud, just make every document include a lightweight, usable application  that can be edited and created locally. One caveat was that applications with massive underlying data sets, even if much of these were never viewed (eg Google Maps), couldn’t possibly be stored locally, and in these big data cases they’d have to be fetched from the cloud. A call to action was made to make httpd for SQL and Hadoop so that accessing data sources is as easy as making an html page.

Keynote 2 – Mark Callaghan (Facebook) on Why Performance is Overrated

Facebook still maintains an absolutely massive number of MySQL instances, and Callaghan is one of Facebook’s ten (!) operations guys who basically keep the damn thing running. The primary point of the talk was to say that at Facebook, they don’t care about peak performance, but instead care about average/constant performance. The rest of the lecture was devoted to how they do everything in their power to avoid stalls in processing. Much of what was presented was very specific to Facebook’s needs. Their current git log for mysql has 452 changes, most of which are being kept internal to the company, but they do occasionally submit patches for MySQL itself. Since the Oracle acquisition this process has become slower. Towards the end of the talk, the Callaghan mentioned that they do have a need to transfer MySQL data into Hadoop, but they are still doing batch transactions to do it because none of the other technology really works.

Session 6 – Daniel Abadi (Hadapt) on Turning Hadoop into an All-Purpose Data Processing Platform

First: Daniel Abadi  is one of the fastest speakers I’ve ever heard, while still be understandable. He must have condensed a one hour lecture into 20 minutes. The lecture consisted of a general overview of Hadapt’s datastore system. Basically, Hadapt feels that having a traditional DBMS next to a Hadoop instance is silly architecture, and are trying to bring some of the DBMS-like features into Hadoop. They aren’t actually sure yet what the best way to store the data is. Abadi had a few hecklers towards the end, as Hadapt has apparently been flip-flopping on this issue. (I believe right now they are using a hacked up version of PostgreSQL.)

Session 7 – Mohamed Y. Eltabahk (WPI) on CoHadoop: Flexible Data Placement and Its Exploitation in Hadoop

This was an academic talk. CoHadoop allows for the creation of localization attributes for files which take better advantage of rack awareness and data placement for more efficient map reduce tasks on Hadoop. There are some kinks in it, but it looks pretty solid and will probably eventually find its way into mainline Hadoop in some form.

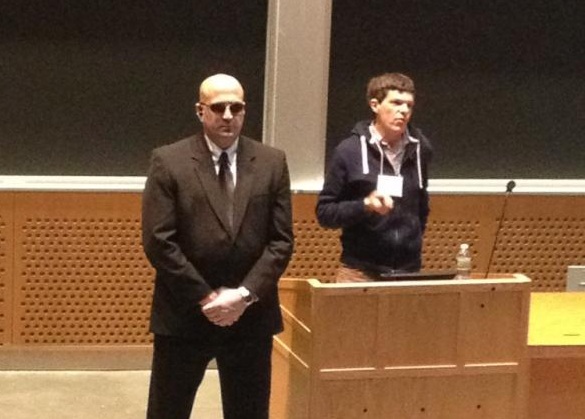
Session 8 – Andy Pavlo (Brown) on Making Fast Databases Faster

This was an interesting/hilarious lecture. Pavlo started behind a door with a bodyguard in front of it. The bodyguard was the full suit, sunglasses, and ear communicator type. He opened the door and escorted Pavlo to the podium, where he remained standing guard during the entire presentation (as well as threatening anyone who asked a question). The point of this schtick was that every time Pavlo’s advisor, Stan Zdonik, asked him to fix a specific problem with H-Store (the academic version of VoltDB), Pavlo would instead fix something that made the occurance of said problem less likely, without ever fixing the actual problem. With each fix, Zdonik became more irate until he “beat him senseless with a 2×4.” Poor Pavlo had to take a restraining order out against Zdonik, hence the bodyguard. Anyways. The actual presentation focused on three optimizations that I believe have all made their way into H-Store at this point, namely better distributing partitions such that distributed transactions are less likely to occur. One of the neat aspects of doing this is they are using machine learning to determine whether or not a transaction is distributed, and how long that may take, to better use other nodes that might be waiting for that transaction to finish. This is all available on github.

Session 9 – Alvin Cheung (MIT) on Automatic Partitioning of Database Applications

The idea here is that a developer can not always see ahead of time when something should be performed by a client application or when it should be run as a stored procedure on a database. Combined with the source code and some profiling information, the authors created a tool that will basically spit out two separate programs – one to run as the application itself, and a second program containing all of the stored procedures to be called. There is some amount of heap and object transfer logic that is generated as well. It was unclear to me how much profiling information was necessary – it wasn’t all automatically captured, and I could imagine that for significantly complex systems determining such information would be difficult.

Session 10 – Jaeyoung Do (U-Wisconsin) on Racing to the Peak: Fast Restart for SSD Buffer Pool Extension

This was a purely academic talk. The authors devised an alternate scheme that doesn’t sacrifice performance compared to other schemes while making SSD’s reach their peak performance rates faster through buffer pool shenanigans. Basically they lazily write to disk instead of forcing copies to disk, and have a log they can use to replay events in case of disk failure.

Session 13 – Yandong Mao (MIT) on Cache Craftiness for Fast Multicore Key-Value Storage

This was pretty gimmicky, but interesting nonetheless. Robert Morris and a few of his students created a single core key value store called MassTree (Massachusetts + Tree) that achieves “kick ass performance”: 5 million inserts per second and 7 million gets per second. The highlight had to be when these performance numbers were compared to VoltDB – the MassTree had a giant bar next to the tiny sliver of VoltDB. Of course, the slide was a joke. These performance numbers will pretty much plummet the second any sort of multi-core or IO scenarios begin, as it relied on keeping the entire data store in memory. Some of the techniques may be applicable to lower layers of other databases, however.

Session 14 – Ross Shaull (Brandeis) on Retro: Modular and Efficient Retrospection in a Database

This was an academic talk that has some amount of administrative use, as well. The author devised a method of adding snapshots to any database which does not currently possess them by using components common to any modern database. It does require an additional set of servers for managing and storing the snapshots, but adding these features through the Retro method to a specific database (I think it was PostgreSQL) only took about 200 lines of modification on the database source (plus all the retro specific code).
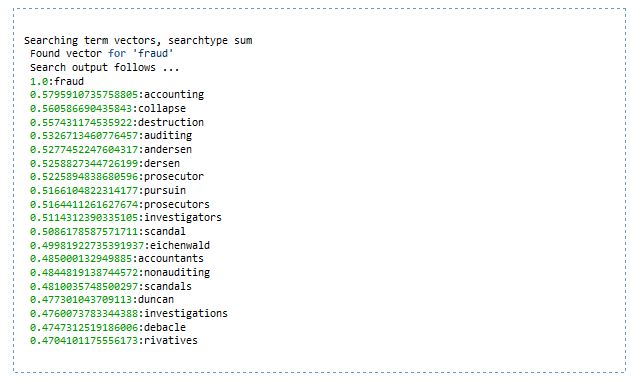
 

How to Set Up Apache Mahout

Apache Mahout is a set of machine learning tools, which deal with classification, clustering, recommendations, and other related stuff. We just bought a new book called Mahout In Action which is full of good examples and general machine learning advice; you can find it here. It’s pretty neat and it’s growing quickly, so I decided to take the time to learn about it.

Mahout functions as a set of MapReduce jobs. It integrates cleanly with Hadoop, and this makes it very attractive for doing text analysis on a large scale. Simpler queries, for instance getting the average response time from a customer, are probably better suited for Hive.

Most examples I’ve seen use Mahout as sort of a black box. The command line just forwards arguments to various Driver classes, which then work their magic. All input and output seems to be through HDFS, and Mahout also uses intermediate temp directories inside HDFS. I tried changing one of the Driver classes to work with HBase data, but the amount of work that seemed to be necessary was non-trivial.

Example

I decided to work with Enron email data set because it’s reasonably large and it tells a story about fraud and corruption. Their use of keywords like ‘Raptor’ and ‘Death Star’ in place of other more descriptive phrases makes topic analysis pretty interesting.

Please read ‘Important things to watch out for’ at the bottom of this post first if you want to follow along.

This is what I did to get the Enron mail set to be analyzed using the LDA algorithm (Latent Dirchlet Allocation), which looks for common topics in a corpus of text data:

  • The Enron emails are stored in the maildir format, a directory tree of text emails. In order to process the text, it first needs to be converted to SequenceFiles. A SequenceFile is a file format used extensively by Hadoop, and it contains a series of key/value pairs. One way to convert a directory of text to SequenceFiles is to use Mahout’s seqdirectory command:
    ./bin/mahout seqdirectory -i file:///home/georges/enron_mail_20110402 -o /data/enron_seq

    This can take a little while for large amounts of text, maybe 15 minutes. The SequenceFiles produced have key/value pairs where the key is the path of the file and the value is the text from that file.

  • Later on I wrote my own Java code which parsed out the mail headers to prevent them from interfering with the results. It is fairly simple to write a MapReduce task to quickly produce your own SequenceFiles. Also note that there are many other possible sources of text data, for instance Lucene indexes. There’s a list of ways to input text data here.
  • I needed to tokenize the SequenceFiles into vectors. Vectors in text analysis are a technical idea that I won’t get into, but these particular vectors are just simple term frequencies.
    ./bin/mahout seq2sparse -i /data/enron_seq -o /data/enron_vec_tf --norm 2 -wt tf -seq

    This command may need changing depending on what text analysis algorithm you’re using. Most algorithms would require tf-idf instead, which weights the term frequency against the size of the email. This took 5 minutes on a 10-node AWS Hadoop cluster. (I set the cluster up using StarCluster, another neat tool for managing EC2 instances.)

  • I ran the LDA algorithm:
    ./bin/mahout lda -i /dev/enron_vec_tf/tf-vectors -o /data/enron_lda -x 20 -k 10

    x is the max number of iterations for the algorithm. k is the number of topics to display from the corpus. This took a little under 2 hours on my cluster.

  • List the LDA topics:
    ./bin/mahout ldatopics -i /data/enron_lda/state-4 --dict /data/enron_vec_tf/dictionary.file-0 -w 5 --dictionaryType sequencefile

    This command is a bit of pain because it doesn’t really error when you have an incorrect parameter, it just does nothing. Here’s some of the output I got:

    MAHOUT_LOCAL is not set; adding HADOOP_CONF_DIR to classpath.
    Running on hadoop, using HADOOP_HOME=/usr/lib/hadoop-0.20
    HADOOP_CONF_DIR=/usr/lib/hadoop-0.20/conf
    MAHOUT-JOB: /data/mahout-distribution-0.5/examples/target/mahout-examples-0.6-SNAPSHOT-job.jar
    Topic 0
    ===========
    i [p(i|topic_0) = 0.023824791149925677
    information [p(information|topic_0) = 0.004141992353710214
    i'm [p(i'm|topic_0) = 0.0012614859683494856
    i'll [p(i'll|topic_0) = 7.433430267661564E-4
    i've [p(i've|topic_0) = 4.22765928967555E-4
    Topic 1
    ===========
    you [p(you|topic_1) = 0.013807669181244436
    you're [p(you're|topic_1) = 3.431068629183266E-4
    you'll [p(you'll|topic_1) = 1.0412948245383297E-4
    you'd [p(you'd|topic_1) = 8.39664771688153E-5
    you'all [p(you'all|topic_1) = 1.5437174634592594E-6
    Topic 2
    ===========
    you [p(you|topic_2) = 0.03938587430317399
    we [p(we|topic_2) = 0.010675333661142919
    your [p(your|topic_2) = 0.0038312042763726448
    meeting [p(meeting|topic_2) = 0.002407369369715602
    message [p(message|topic_2) = 0.0018055376982080878
    Topic 3
    ===========
    you [p(you|topic_3) = 0.036593494258252174
    your [p(your|topic_3) = 0.003970284840960353
    i'm [p(i'm|topic_3) = 0.0013595988902916712
    i'll [p(i'll|topic_3) = 5.879175074800994E-4
    i've [p(i've|topic_3) = 3.9887853536102604E-4
    Topic 4
    ===========
    i [p(i|topic_4) = 0.027838628233581693
    john [p(john|topic_4) = 0.002320786569676983
    jones [p(jones|topic_4) = 6.79365597839018E-4
    jpg [p(jpg|topic_4) = 1.5296038761774956E-4
    johnson [p(johnson|topic_4) = 9.771211326361852E-5
  • Looks like the data needs a lot of munging to provide more useful results. Still, you can see the relationship between some of the words in each topic.

I recommend playing around with the examples in the examples/bin directory in the Mahout folder.

Important things to watch out for

  • I ran out of heap space once I asked Mahout to do some real work. I needed to increase the heap size for child MapReduce processes. How to do this is basically described here. You only need the -Xmx option, and I went for 2 gigabytes:
    <property>
       <name>mapred.child.java.opts</name>
       <value>
         -Xmx2048M
       </value>
     </property>

    You may also want to set MAHOUT_HEAPSIZE to 2048, but I’m not sure how much this matters.

  • Some environment variables weren’t set on my StarCluster instance by default, and the warnings are subtle. HADOOP_HOME is particularly important. If HADOOP_HOME is not set, MapReduce jobs will run as local jobs. There were weird exceptions accessing HDFS, and your jobs won’t show up in the job tracker. They do warn you in the console output for the job, but it’s easy to miss. JAVA_HOME is also important but it will explicitly error and tell you to set this. HADOOP_CONF_DIR should be set to $HADOOP_HOME/conf. For some reason it assumes you want HADOOP_HOME/src/conf instead if you don’t specify. Also set MAHOUT_HOME to your mahout directory. This is important so it can add its jar files to the CLASSPATH correctly.
  • I ended up compiling Mahout from source. The stable version of Mahout had errors I couldn’t really explain. File system mismatches or vector mismatches or something like that. I’m not 100% sure that it’s necessary, but it probably won’t hurt. Compilation is pretty simple, ‘mvn clean install’, but you will probably want to add ‘-DskipTests’ because the tests take a long time.

Boston’s Big Datascape, Part 2: Nasuni, VoltDB, Lexalytics, Totutek, Cloudant

[Excerpted from the Riparian Data blog]

This ongoing series examines some of the key, exciting players in Boston’s emerging Big Data arena. The companies I’m highlighting differ in growth stages, target markets and revenue models, but converge around their belief that the data is the castle, and their tools the keys. You can read about the first five companies here.

6) Nasuni

  • Product: Nasuni is an cloud enterprise storage system. Their Nasuni Filers propagate data from a local disk cache to cloud storage, essentially giving users a unified file share in the cloud that doesn’t require replication of file servers.
  • Founder: Andres Rodriguez
  • Technologies used: on-premise storage, UniFS™ file system, VMs, cloud storage
  • Target Industries: Manufacturing, Construction, Legal, Education
  • Location: Natick, MA


7) VoltDB

  • Product: VoltDB is an in-memory relational database designed to handle millions of operations per second (125k TPS per commodity server) with near-perfect fault tolerance and automatic scale-out. It has three flavors—an Enterprise, startup/ISV, and community edition.
  • Founder: Michael Stonebraker (ln)
  • Technologies used: in-memory DBMS, OLTP, ACID, SQL
  • Target industries: Capital Markets, Digital Advertising, Online Games, Network Services
  • Location: Billerica, MA

[Read the full post]

Boston Hadoop Meetup Group: The Trumpet of the Elephant

Heheh. But seriously, if you live in the Boston area and are working with Hadoop, or interested in working with Hadoop, or just think the name is fun to say, you should absolutely clear your calendar the night of February 15. Why? Because it’s the first Boston Hadoop Meetup Group since November, and judging by the presenter line-up, it’s going to be a doozie (or an Oozie, if you want to get all topical).

First up, MapR’s Chief Application Architect Ted Dunning (t|l) on using Machine Learning within Hadoop. I’m really excited about this one.

Second, Cloudera Systems Engineer Adam Smieszy (t|l) on integrating Hadoop into your existing data management and analysis workflows.

Last, Hadapt’s CTO Philip Wickline (t|ln) “will give a high-level discussion about the differences between HBase and Hive, and about transactional versus analytical workloads more generally speaking, and dive into the systems required for each type of workload. ”

Each talk will run about 15-20 minutes, with time for Q&A after, followed by (free) beer and mingling.

The Boston Hadoop MeetUp Group is organized by Hadapt’s Reed Shea (t|l). Hadapt is doing some very very cool stuff with unstructured and structured data processing and analytics–cool enough that founder/Chief Scientist Daniel Abadi took teaching leave from Yale to turn his research into a product.

This particular MeetUp is sponsored by Hadapt, MapR, Cloudera and Fidelity, and is being held at Fidelity’s downtown office, from 6 to about 8:30 pm. For more information and to sign up, visit the event page.

See you there!

Boston’s Big Datascape, Part 1

[Excerpted from the Riparian Data blog]
Big Data, or the technologies, languages, databases and platforms used to efficiently store, analyze and extract conclusions from massive data sets, is a Big Trend right now. Why? In a nutshell, because a) we are generating ever increasing amounts of data, and b) we keep learning faster, easier and more accurate ways of handling and extracting business value from it. On Wall Street, some investment banks and hedgefunds are incorporating sentiment analysis of web documents into their trading strategies. In healthcare, companies like WellPoint, Explorys and Apixio are using distributed computing to mine health records, practice guidelines, studies and medical/service costs to more accurately and affordably insure, diagnose and treat patients.

Unsurprisingly, Silicon Valley is big data’s epicenter, but Boston, long a bastion of Life Sciences, Healthcare, High Tech and Higher Ed, is becoming an important player, particularly in the storage and analytics arenas. This series aims to spotlight some of the current and future game changers. These companies differ in growth stages, target markets and revenue models, but converge around their belief that the data is the castle, and their tools the keys.

1)      Recorded Future

  • Product: Recorded Future is an API that scans, analyzes and visualizes the sentiment and momentum of specified references in publically available web documents (news sites, blogs, govt. sites, social media sites etc)
  • Founder/CEO: Christopher Ahlberg
  • Technologies used: JSON, real-time data feeds, predictive modeling, sentiment analysis
  • Target Industries: Financial Services, Competitive Intelligence, Defense Intelligence
  • Located: Cambridge, MA

2)      Hadapt

  • Product: The Hadapt Adaptive Analytical Platform is a single system for processing, querying and analyzing both structured and unstructured data. The platform doesn’t need connectors, and supports SQL queries.
  • Founders: Justin Borgman (CEO); Dr. Daniel Abadi (Chief Scientist)
  •  Technologies used: Hadoop, SQL, Adaptive Query Execution™
  • Target Industries: Financial Services, Healthcare, Telecom, Government

[Read the full post]