In the latest version of SQL Server, SQL Server 2012, Reporting Services now supports the Office 2007\2010 XLSX file format (aka Office Open XML file format) in its Excel renderer. In fact that is the default format for the Excel renderer. The old renderer for the legacy Excel 2003 XLS format has been named to “Excel 2003” but it has been deprecated and is not visible in the available export options list by default. For reference see the related section in the MSDN documentation. Although SSRS 2012 has now the ability to export an RDL report into an Excel XLSX workbook, the Excel renderer still has certain limitations. In this blog post, we will discuss some of these limitations and compare them to the OfficeWriter renderer in SSRS.
Charts
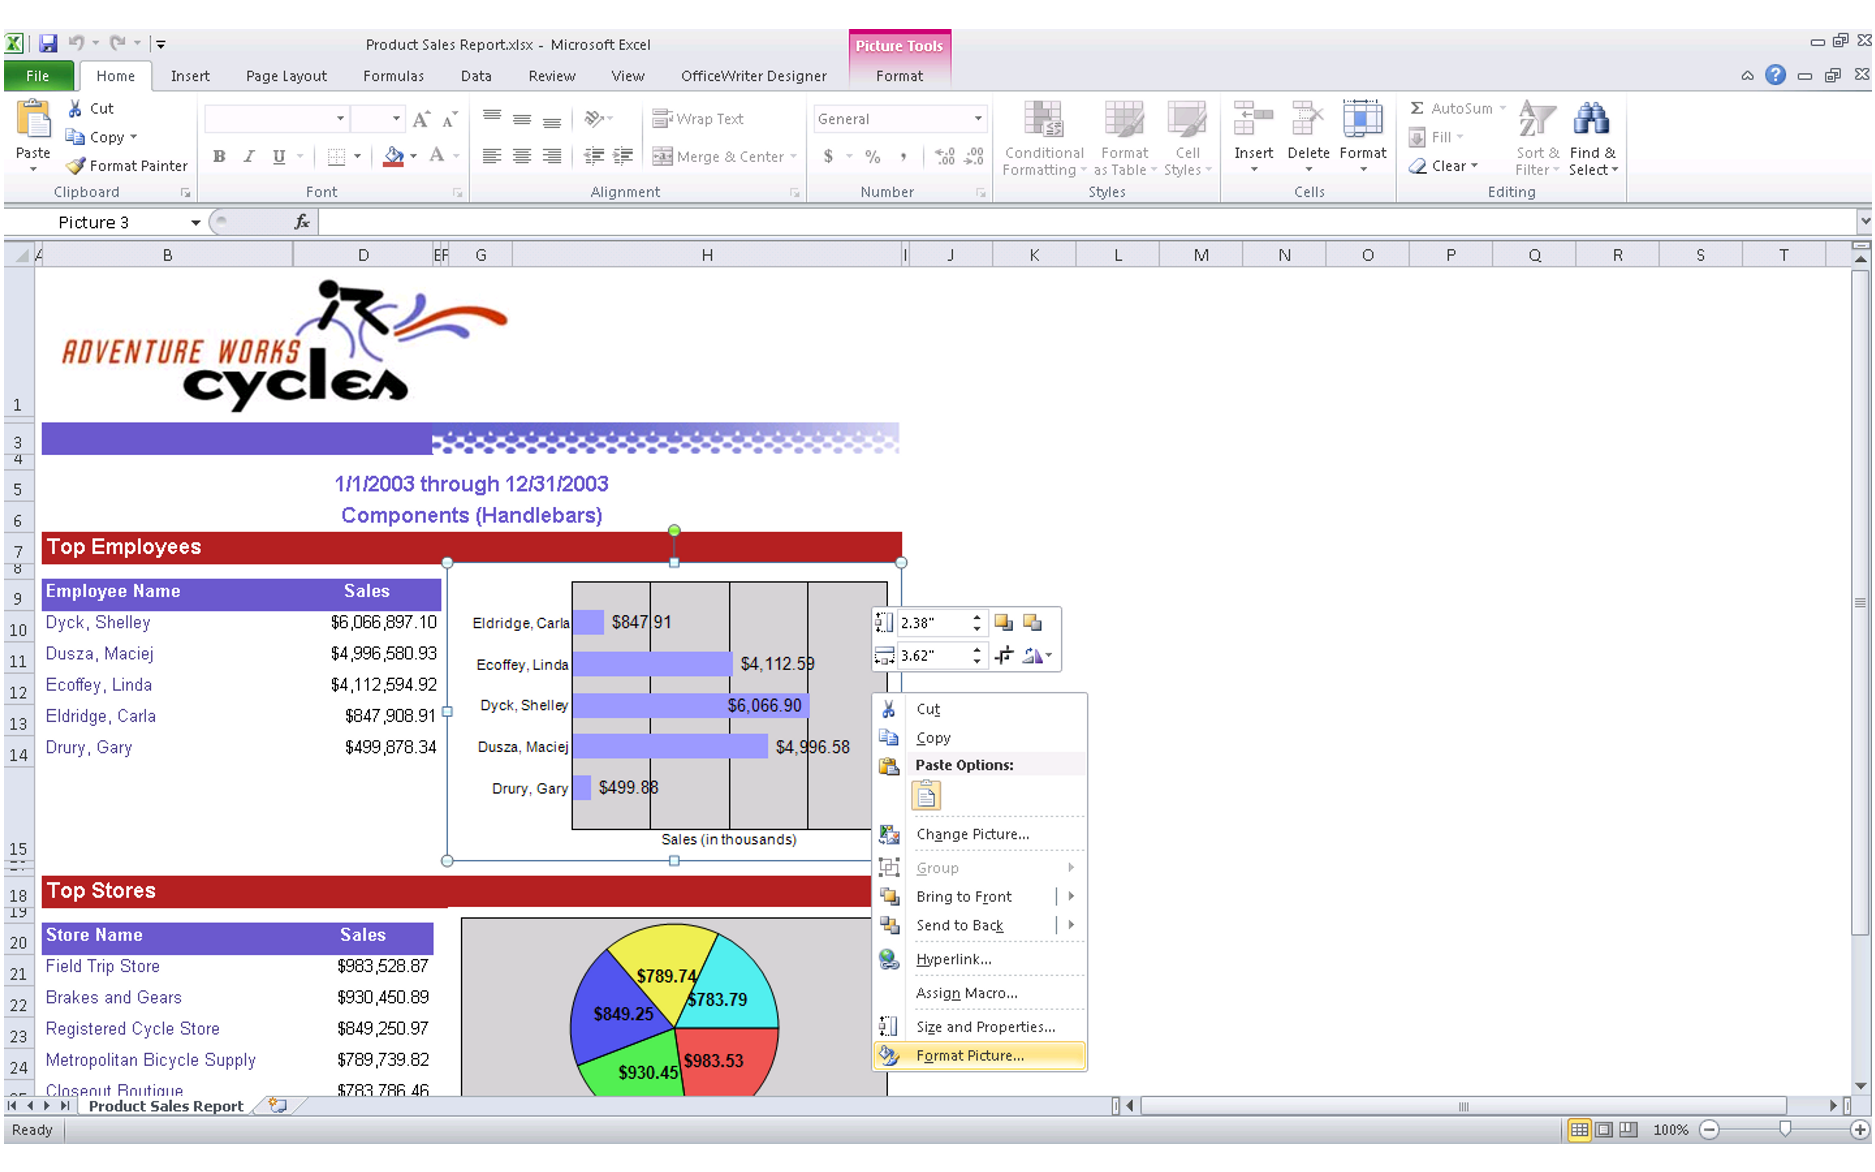
Probably one of the major limitations is that charts will be exported as pictures. In the related section in the MSDN documentation it states:
“Charts, sparklines, data bars, maps, gauges, and indicators are exported as pictures. The data they depict, such as the value and member labels for a chart, is not exported with them and is not available in the Excel workbook unless it is included in a column or row in a data region within a report.”
With the OfficeWriter renderer on the other hand, the charts will be native Excel charts with live data. Let’s see the difference in the following screenshots:
“Product Sales Report.xlsx” generated using the SSRS 2012 Excel renderer (note that the chart is a picture)
“Product Sales Report.xlsx” generated using the OfficeWriter renderer in SSRS
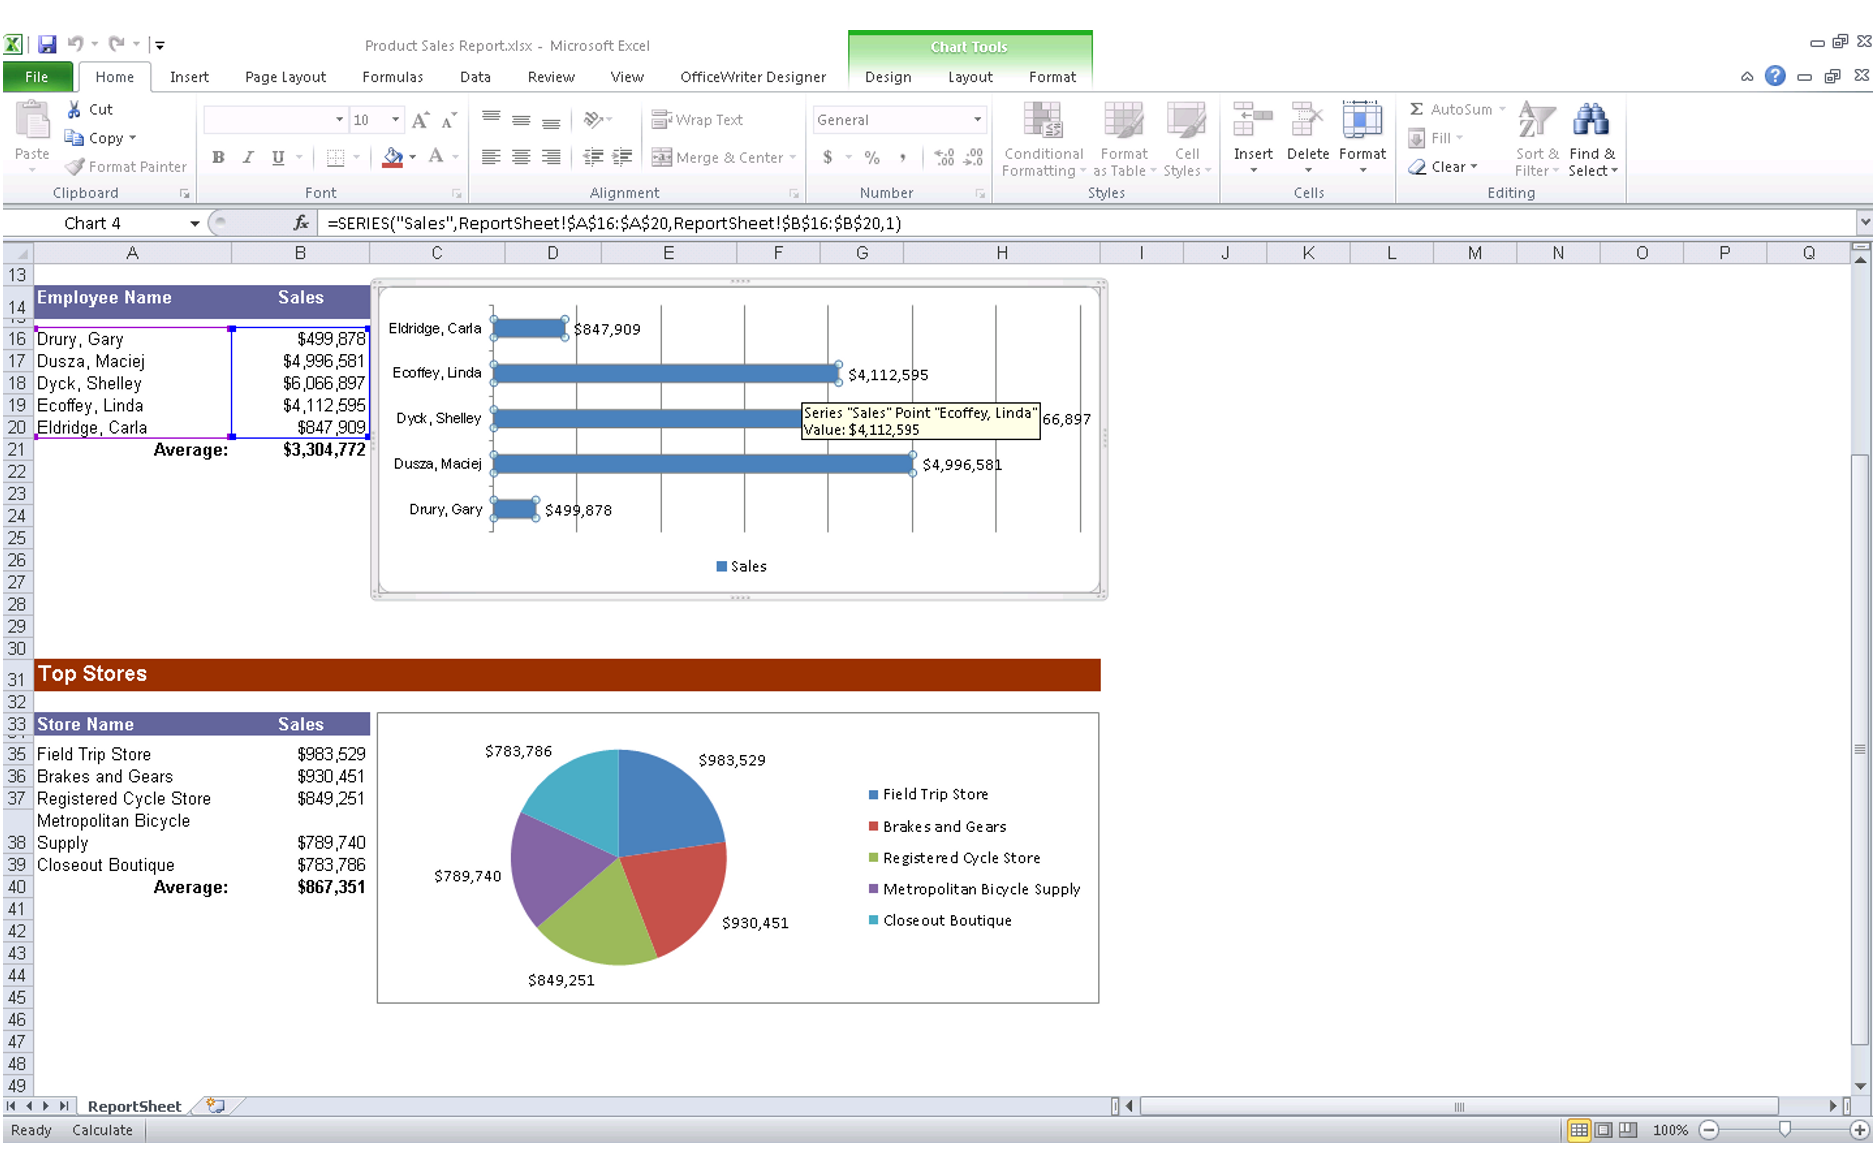
As seen in the second screenshot, the chart is actually a native Excel chart object.
Freeze Panes
Using the SSRS 2012 Excel renderer, the part in the RDL report that can be exported to Excel as freeze panes is the page header. As for freezing the tablix headers, the build-in Excel renderer doesn’t set them as freeze panes in the exported Excel workbook. However, with the OfficeWriter renderer, you can set anywhere in the report as freeze panes.
Images in Header and Footer sections
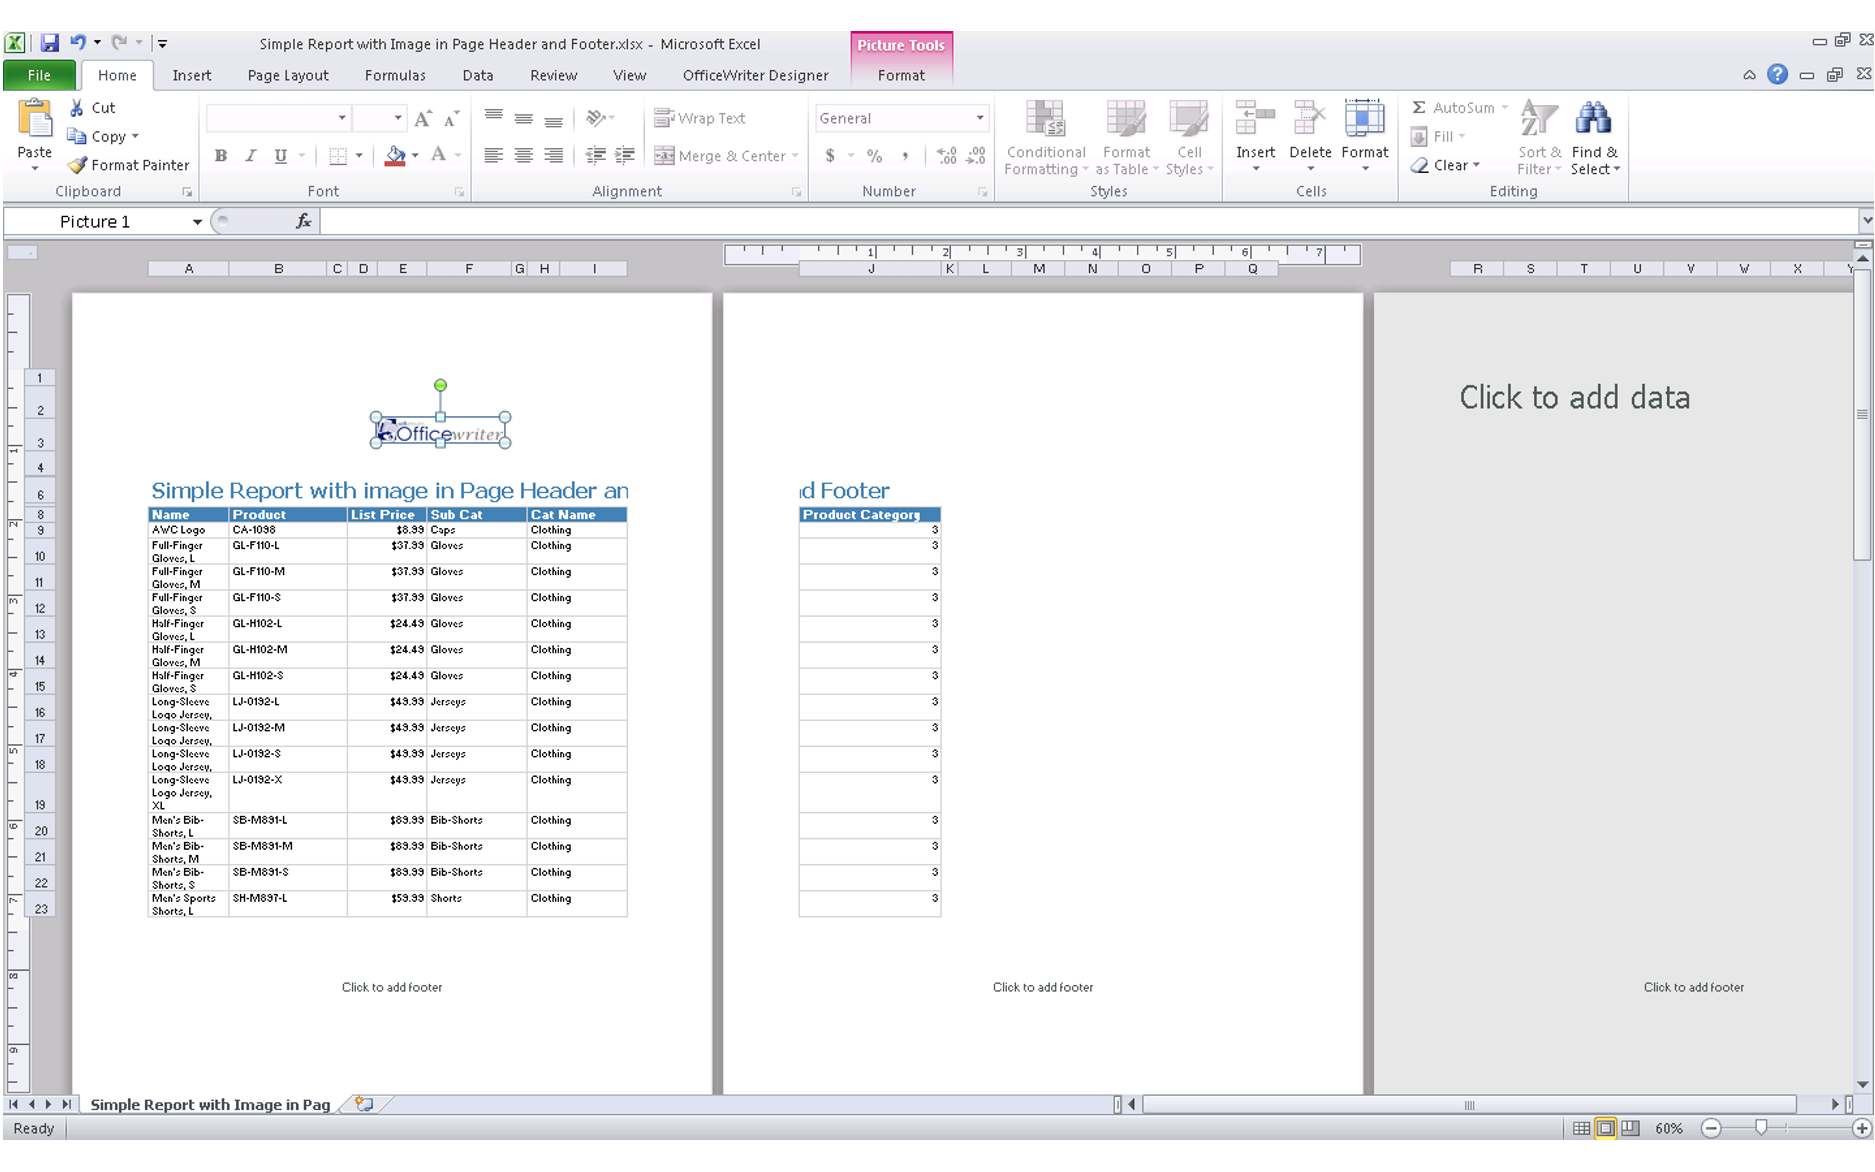
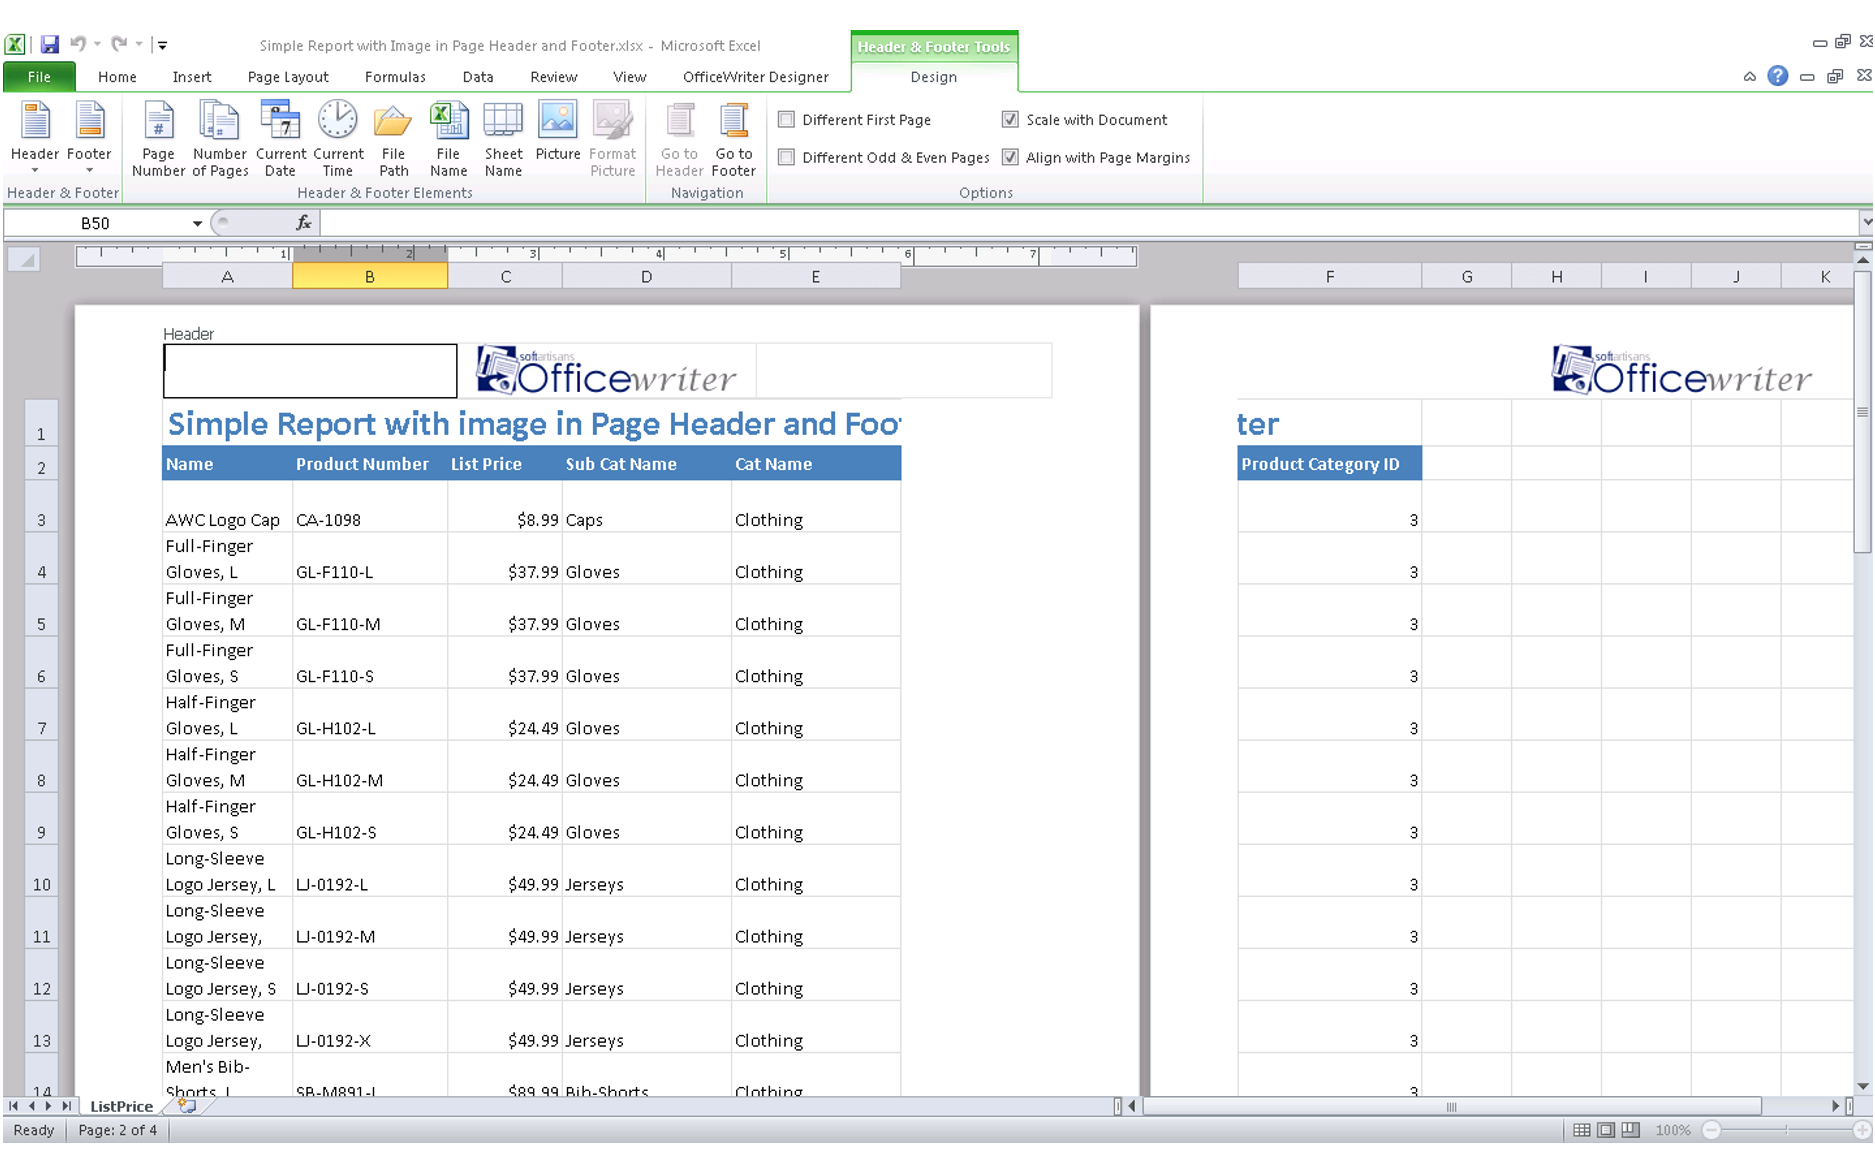
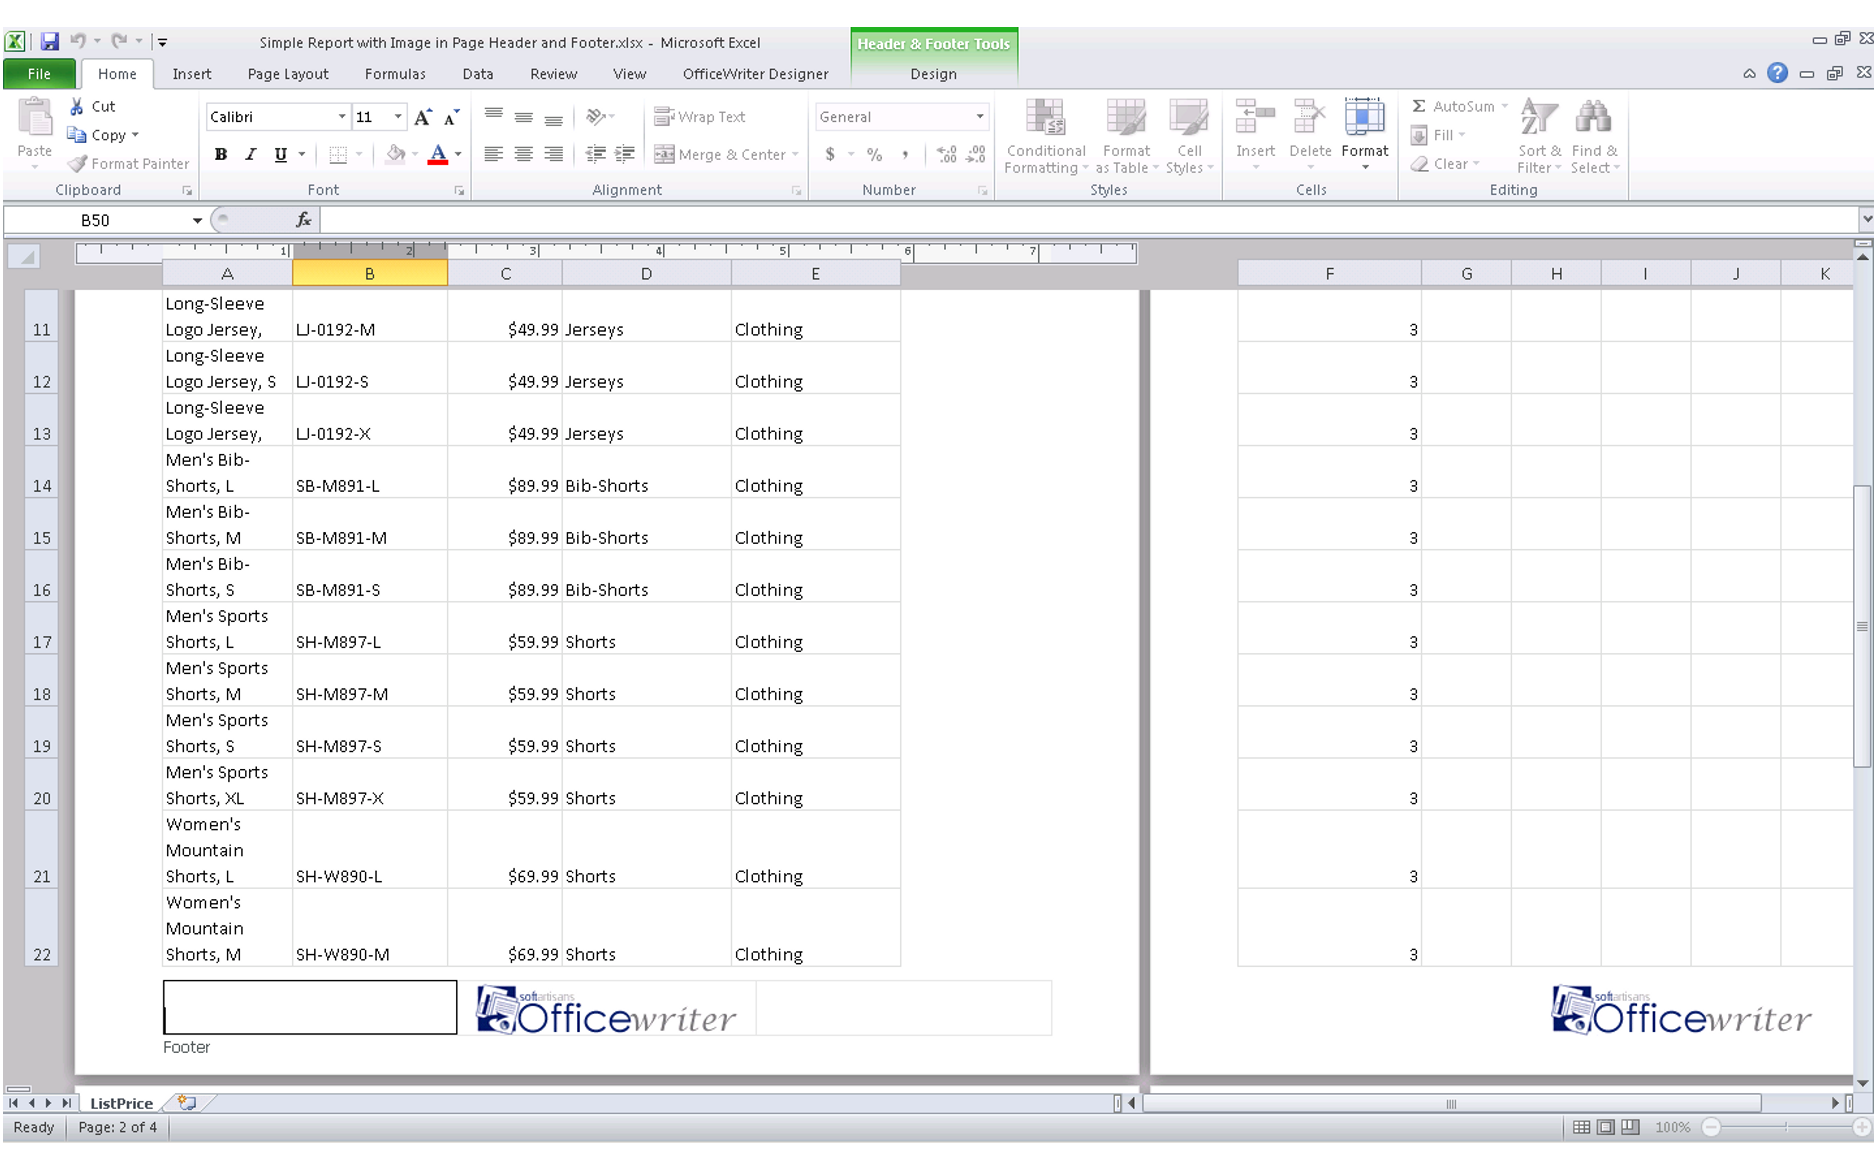
If you have an image in the page header or footer in the RDL report, when exported to Excel using the SSRS 2012 Excel renderer, the image in the page header shows as a regular picture object at the top of the worksheet (inside freeze pane) rather than in the actual worksheet header section. As for the footer image, the picture doesn’t get placed at all. However, with the OfficeWriter renderer, images in both page header and footer in the report are exported as images inside the actual worksheet header and footer sections (in other words, the images appear within the “&[Picture]” place holder). Let’s see the difference in the following screenshots:
“Simple Report with Image in Page Header and Footer.xlsx” generated using the SSRS 2012 Excel renderer (note that the footer section has no image)
“Simple Report with Image in Page Header and Footer.xlsx” generated using the OfficeWriter renderer (both the header and footer sections include the actual image at its place holders)
MERGED CELLS
In addition to what we discussed above, there are also other features in Excel, such as merged cells and wrapped text, that need to be considered when using the built-in SSRS 2012 Excel renderer. Basically, in order to replicate the original report layout in the RDL , the Excel renderer is often making use of merged cells and wrapped text in the worksheet. However, as explained in the MSDN documentation, under the “Merging Cells” section, merging cells can cause some difficulties with the Excel sort functionality. It states:
“Merged cells can cause problems because the sort functionality in Excel requires cells to be merged in a very specific way for sort to work properly. For example, Excel requires that the ranges of merged cells have the same size in order to be sorted.”
To conclude our discussion, for simple reports that don’t require much interaction with the data in the spreadsheet (charts and formulas for example), if all it needs is the static display of the data, then the SSRS 2012 Excel renderer should be sufficient. However, if your reports require real Excel charts that interact with live data, live formulas, freeze panes at any given location in the worksheet, headers and footers with images, full control on the utilization of merged cells, styles and formatting, then the OfficeWriter renderer has to be used.
As an important note, since OfficeWriter renderer utilizes an existing Excel template under the hood that will be designed in the OfficeWriter Designer add-in in Excel itself, it supports all the Excel features that can be added to the template at the design time. This would include, but not be limited to, pivot tables, pivot charts, conditional formatting, data validations, formulas, named ranges etc.
In addition to what we discussed above, it is good to underline that OfficeWriter, along with its rendering extension within SSRS, also provides a full blown ExcelApplication API, which could also be used within a custom ASP.NET application in conjunction with the Reporting Services SOAP API to do further processing of the generated Excel report.
Get started:
Download more information on SSRS integration or start your free trial of OfficeWriter below.
Share the post "Comparing Excel Export Functionality in SSRS 2012 to OfficeWriter"


 Follow