[In OfficeWriter 8.6 we introduced support for sparklines in your Excel reports. Sparklines are mini graphs that live within a cell of your Excel spreadsheet to quickly visualize and identify trends in your data. Below is an example of how to use sparklines within OfficeWriter reports.]
Hi! My name is Kyle and I worked on developing support for sparklines in ExcelTemplate. For those unfamiliar, a sparkline is basically a small chart that lives in a single cell. Sparklines are a great way to quickly visualize trends in data, especially if they are located in cells near their data source.
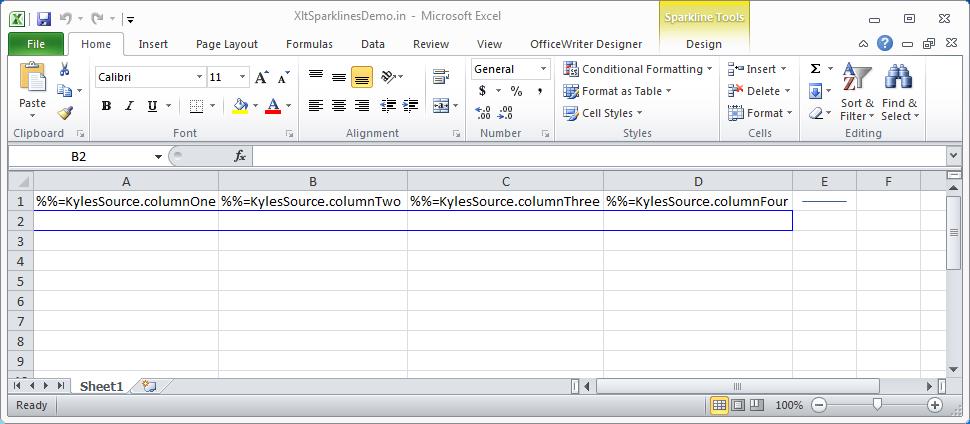
Below we’ve put together a demo of using sparklines within OfficeWriter’s ExcelTemplate. The first step is to insert data markers and sparklines into the file. Here I’ve inserted a sparkline next to the row of data markers and created a group of sparklines immediately below the data markers. The data source for the sparkline in cell E1 is A1:D1. The data source for the sparkline in cell A2 is A1 and so on for the rest of the group. Continue reading Sparklines in OfficeWriter
