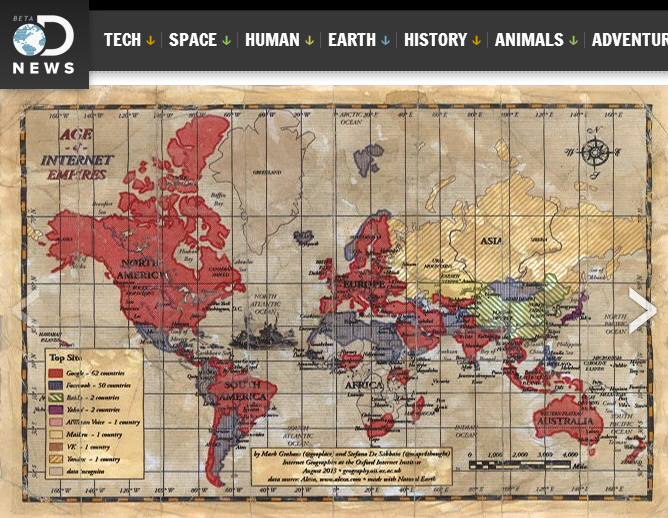
From art to cancer patient care, consumer goods to the NBA, Big Data is piling up and these companies are finding ways to make sense of it all. Scroll through the slideshow below to find out how.
Cities Reduce Wasteful Power Consumption
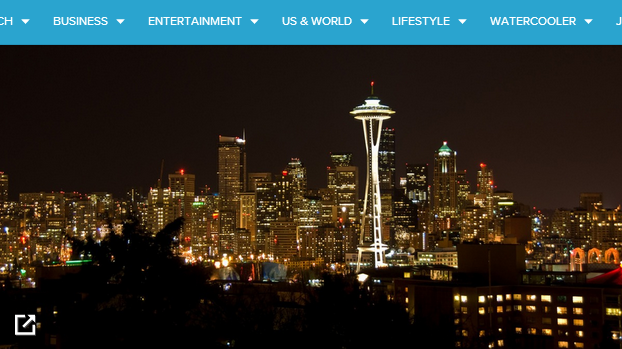
Cities across the US are opening their data to the public, allowing for coders and companies to create projects to better the city in which they live and play. One such city is Seattle. Partnering with Microsoft and Accenture, the city of Seattle is making data about its downtown buildings' power consumption available to be analyzed. The goal of the project is to reduce wasteful power consumption by 25%.
NBA Scores Big with Fans
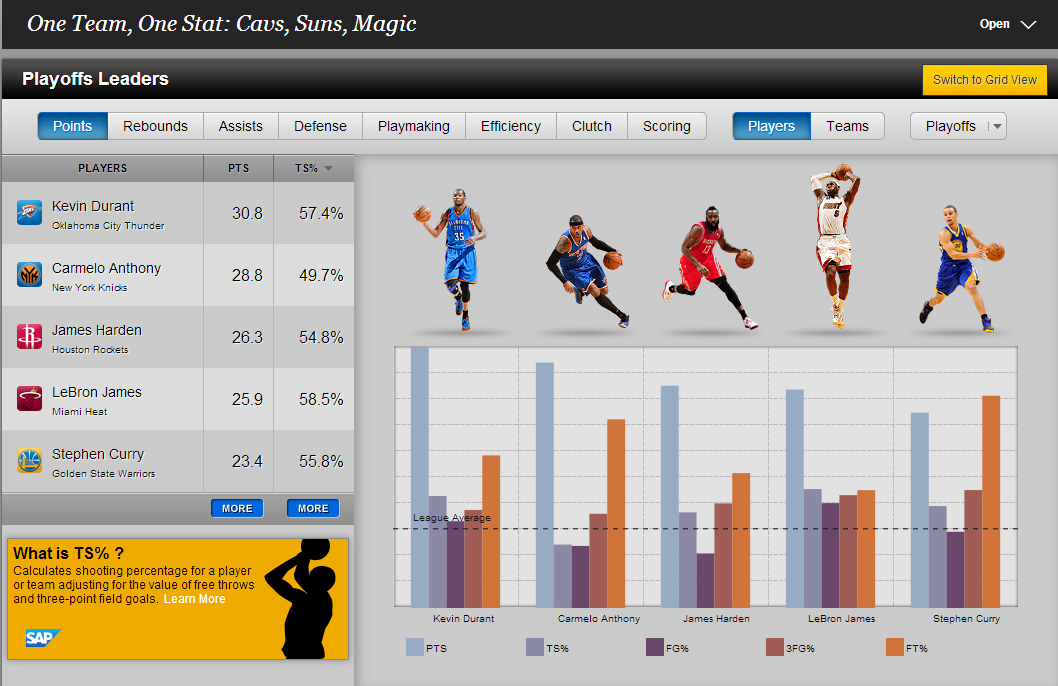
Partnering with SAP, the National Basketball Association offered fans access to unlimited official NBA statistics this summer, including every box score in NBA history. And they did all of this free of charge to fans. Previously, this data was restricted to league and NBA team personnel. By opening this data to the public (and in an impressive visual way), sports fans were able to interact with and analyze official league, team, and player statistics in real-time. Creating this real-time data platform gave fans a way to interact with and become more heavily involved with the games and players.
Mitsui Knowledge Industry (MKI) Allows for Real-Time Genome Analysis
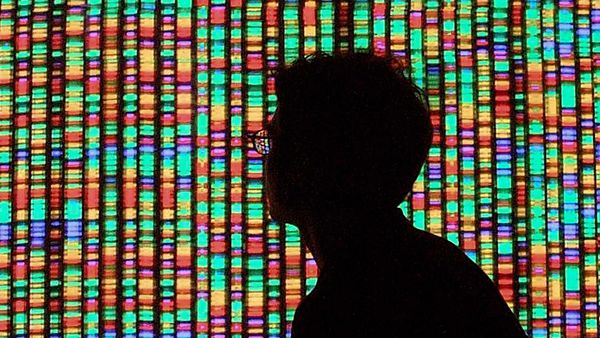
Tackling patient care in Japan is Mitsui Knowledge Industry, a biotech company specializing in information and communication technology. Mitsui Knowledge Industry is using real-time analysis of patient genome data to personalize and improve upon cancer treatment. What used to take up to two days to analyze complex genomes, can now be performed in 20 seconds, and Mitsui Knowledge Industry is part of those efforts.
The Smithsonian Maps Your Changing Town
Map-makers have found visually stunning ways to use Big Data. Discovery News featured a slideshow of maps created from the insights collected on servers across the globe. Among these innovative map artists is The Smithsonian in Washington D.C.. The Smithsonian Museum took vintage maps of select cities (including Los Angeles, New York, and San Francisco) and overlaid them with satellite images of today’s cities, providing viewers with a before-and-after picture of the cities’ layouts. Among other organizations and maps featured on Discovery News' slideshow were Big Foot sightings, craft breweries, and the oldest buildings in New York.
Through the above examples of striking visualizations to interactive user experiences, we’re seeing companies and individuals find unique ways to leverage the data and insights being collected daily. How are you seeing Big Data used within your industry? Do you have any examples? Let us know!
Continue reading Creative ways companies are making use of Big Data →