Intro
A customer came to me recently with the following request:
I have a fairly simple question, but cannot seem to make it work. I’m creating a simple table in OfficeWriter Excel. One column outputs general sales dollars. I’m trying to create a column next to it that will populate the % of the total sales for each row. So, it will look like this:
Store Sale $ % of Sales Total Store 1 $2500 50% Store 2 $2500 50% Excel Pivot Tables can do this easily using the Field Value Settings, however, I’m creating a simple table and NOT a pivot table. Any help would be great.
We’re going to start by walking through how to create a % of Total column in Excel with static data. Read how to do this in a pivot table and with ExcelWriter data markers .
Solution
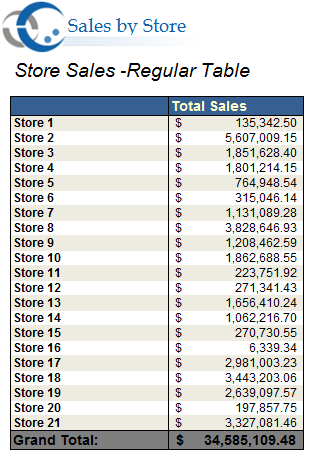
We start with a basic table that has the total sales for a number of stores. We want to add a column that shows each store’s sales total as a percentage of the sales total over all the stores.
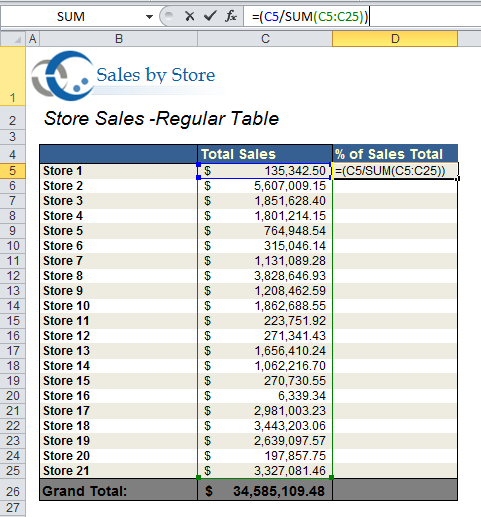
1. Add space for the new column. You may need to do some reformatting later, but for the purpose of visuals, I did this in the beginning.
2. The formula will be Percentange = Individual Store Sales / Total Sales for all Stores, where the individual store sales will change depending on the row.
3. If ‘Store 1’ is in Row 5 and the % of Total column is D, we can set up the formula: =(C5/SUM(C5:C25)). In this case, you could also use =(C5/C26) because C26 alread contains the sum of all the stores’ sales totals.
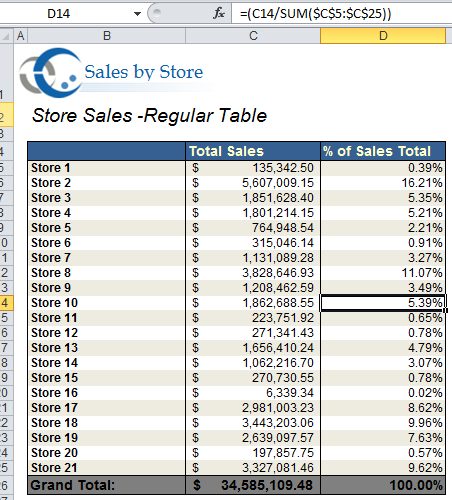
4. Before we apply the formula to the other rows, we need to make sure that the sum uses absolute references so the numbers don’t change when the formula is copied. The final formula should be =(C5/SUM($C$5:$C:$25)).
5. Apply the formula to the other rows via copy-paste or click-and-drag.
6. Clean up the formatting as desired.
7. (Optional) Add a sum formula for the percentage


 Follow