Build a Meteor web app! Riparian Data will provide the sustenance (pizza and beer, of course). We’ll provide the location. You provide the know-how.
Join us Wednesday, April 3rd.
Build a Meteor web app! Riparian Data will provide the sustenance (pizza and beer, of course). We’ll provide the location. You provide the know-how.
Join us Wednesday, April 3rd.
Our weekly series, Truth in Tech, is now a podcast! So you can listen at your convenience – at your desk or on-the-go.
1. Acquisitions Galore:
Pinterest Buys Livestar: Livestar amalgamates reviews for restaurants, movies, and music from reputable sources such as newspapers, local news blogs, Facebook friends, or people in your contact list. The acquisition cost wasn’t revealed, but Livestar did have some top investors and $2 million in funding
Babbel Startup buys PlaySay: Babbel is a language learning startup. PlaySay is a English/Spanish learning app for the iPhone where you can have real conversations with pronunciation feedback. Again exact amount of buyout not revealed, but Babbel’s goal is to break into the US Market.
2. Google launches Keep on Android and Google Drive: Keep is Google’s version of Evernote that syncs to your Google Drive. It’s android only at the moment, but wired predicts an iOS version soon
“The drones, or unmanned aerial systems, have already helped the police find missing people and county planners measure the growth of a landfill. But they could also be used by drug dealers, pedophiles and nosy neighbors, the witnesses and a senator said.” Currently, only government agencies and police departments can fly drones, but the FAA will have rules in place for commercial use by 2015.
Square may bill itself as the simplest way to pay–but Continue reading Truth in Tech Ep. 10: Acquisitions, Drones, & Starbucks Square

Performance is a widely overlooked feature in the development world. In enterprise development, better performance can correlate directly to company profit. More efficient programs utilize fewer resources; fewer resources cost less money.
On the consumer end, performance can make or break a product. One reason Google has such great market share is the speed at which they deliver their applications and data. The philosophy is pretty simple really: when users have to wait for something, they either get distracted (in which case they forget about you) or frustrated (in which case they’re mad at you).
The bottom line is performance matters. That’s why performance testing is vital to any product and company. I’ve outlined a few resources that I’ve found to be the most useful for performance testing below:
Steve Souders is the head performance engineer at Google and has literally written THE book on web performance. I’ve been on Steve’s RSS feed Continue reading Resources Every Performance Tester Should Know About
Every year in March, the NCAA hosts the college Men’s Basketball Tournament. Every year, I go through all of the teams, create my brackets, and see if I can do better than my friends. My one downfall is I always have my favorites: you know, the teams you follow because you went to school there, the team your significant other cheers for, your alma mater’s arch-nemesis, or the team with that really cool mascot. Whatever the reason, the biases end up costing you the first round, sidelining you out of the pool. What we need is a simple way to generate our bracket and remove some of that bias.
Instead of using a totally random outcome, let’s use a few of Excel’s analytical features to increase our chances of putting together a winning bracket. Let’s take Mens NCAA Basketball tournament data since 1985 (courtesy of The Washington Post‘s database), that has the history for specific seeds, teams, coaches and conferences – everything from each school’s tournament results to how No. 7 seeds have fared against No. 10 seeds in the first round. Using this data as a starting point allows us to inject reality into our random numbers. Because really, it is not ever worth considering if a 16 can beat a 1, right?
After copying and pasting the data from the webpage into an Excel spreadsheet, it’s time to input the formulas. It’s basically a two-step process. What we need to calculate is the probability of a particular seed winning or losing. If you hadn’t seen it before, a 9 seed beets an 8 seed more often than not, and a 1 seed has never lost. The pivot table I created reflects that, proving to be a useful tool in our selection process. It’s not too difficult to create a pivot table by seed and win/loss and by round for our source data. (See the workbook attached at the end of this post.)
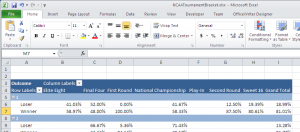
Next, we develop a formula that uses the probabilities along with the RAND() function to predict the outcome of a match-up. All we need to do is apply the random number to the pivot table data to determine which of the two seeds advance to the next round. There is no easy way to do this, except with a long and complicated formula. Luckily, most of the formula is calculated by Excel by doing a simple click. The two Excel functions that get this done for us are the RAND() and the GETPIVOTDATA(). RAND() is well documented, but the GETPIVOTDATA() allows us to treat the pivot data like a database to get our probability for a seed to win the match-up.
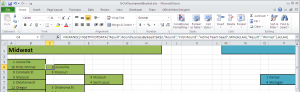
After playing with the output for a few runs, I noticed that the later rounds are fully dominated by the higher seeds. That happens because of the limited data for lower seeds in the later rounds. I want to allow for those Special Case teams to triumph over the Big League teams, so I added Continue reading March Madness: Predict Your NCAA Basketball Brackets with Excel
With data sets tied to different data sources and multiple people handling one report, the process of building a report can get messy. OfficeWriter’s built-in Designer Ribbon makes it easier to interact with SQL Server Reporting Services (SSRS), helping you access reports from your applications on time and with ease. Join us Friday, March 22nd as our Senior Sales Engineer, Chad Evans, shows you how this feature makes using SSRS simpler.
In this webinar you will learn:
We will also have a question and answer period at the end of the webinar. Feel free to send in questions prior to the webinar so that we can include them in the presentation.
When: Friday, March 22nd at 1 P.M. EST
Can’t attend, but still want a copy of the recording and slides? Register below and we’ll email it out following the webinar.
**Spots are limited. So please register early to secure your seat.

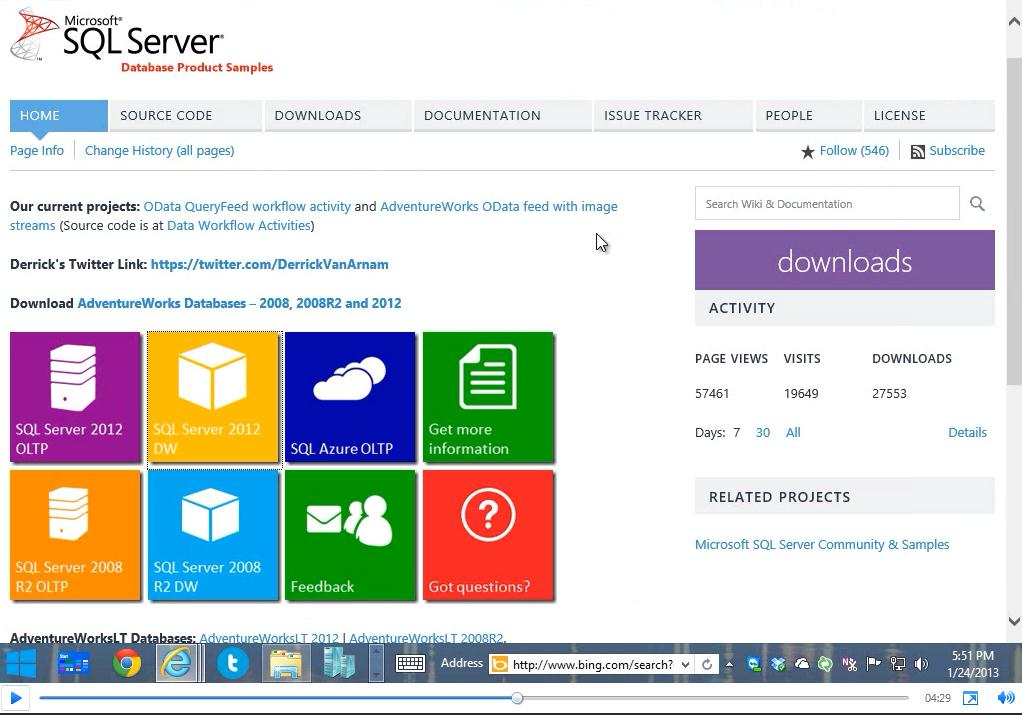
 We partnered with Andrew Brust from Blue Badge Insights to integrate OfficeWriter with Hadoop and Big Data. Taking existing OfficeWriter sample projects, Andrew discusses how he created two demos showing OfficeWriter’s capabilities to work with Big Data. One demo uses C#-based MapReduce code to perform text-mining of Word docs. The other demo focuses on connecting to Hadoop through Hive.
In these demos you will learn:

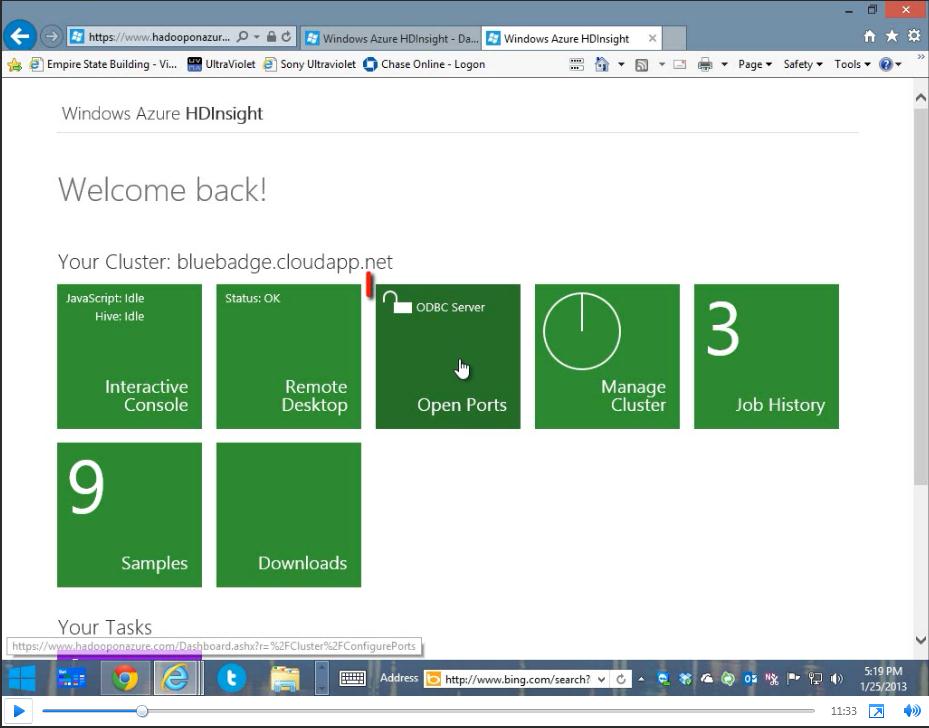
 We’re taking OfficeWriter to the cloud. In these videos you’ll see how OfficeWriter runs on Windows Azure. Taking our exisiting OfficeWriter web sample projects, Andrew Brust from Blue Badge Insights made them run on the Windows Azure cloud platform.
In these videos you will:

Because we had such a great response from the first webinar, we’re opening more seats and hosting this PivotTable webinar again.
Take a first look at the new PivotTable API within OfficeWriter 8.4 in this interactive webinar.
Our Senior Sales Engineer (and adept demo master), Chad Evans, will walk you through several ways PivotTables can help you wrangle and report on your data. Bring your questions or email them beforehand and we’ll be happy to include them.
When:
Friday, March 1, 2013 at 1 p.m. EST
What we’ll cover:
Spots are limited. Save your seat and register today.

Can’t attend, but still want to learn more? Register anyway! We’ll send the slides and a recording of the webinar after the event.

Hello, everyone, and welcome to another edition of Pitan Pivot Mage!
Today we will cover how to select slicer values with VBA. This is especially useful if you have a report generated by OfficeWriter’s ExcelTemplate model and you can’t select the slicer values in the template file.
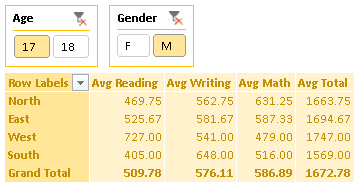
Let’s start out with an ExcelWriter report template. It has some data off to the side and a PivotTable that summarizes the test scores with averages. There are two slicers for filtering on age and gender.
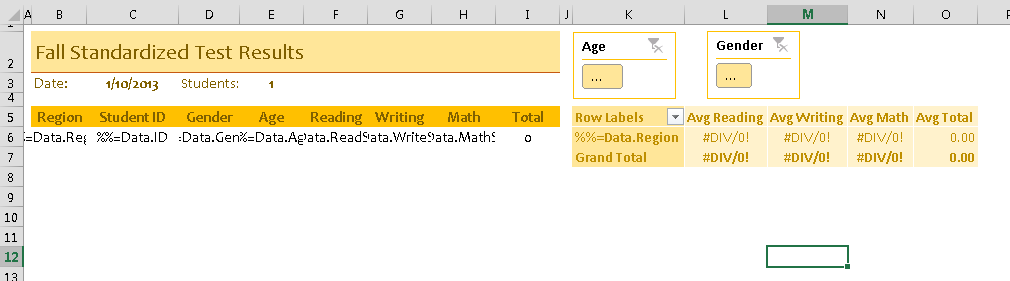
When it’s populated with data, all of the values in the slicers are automatically selected, so the default is a full view of the data.
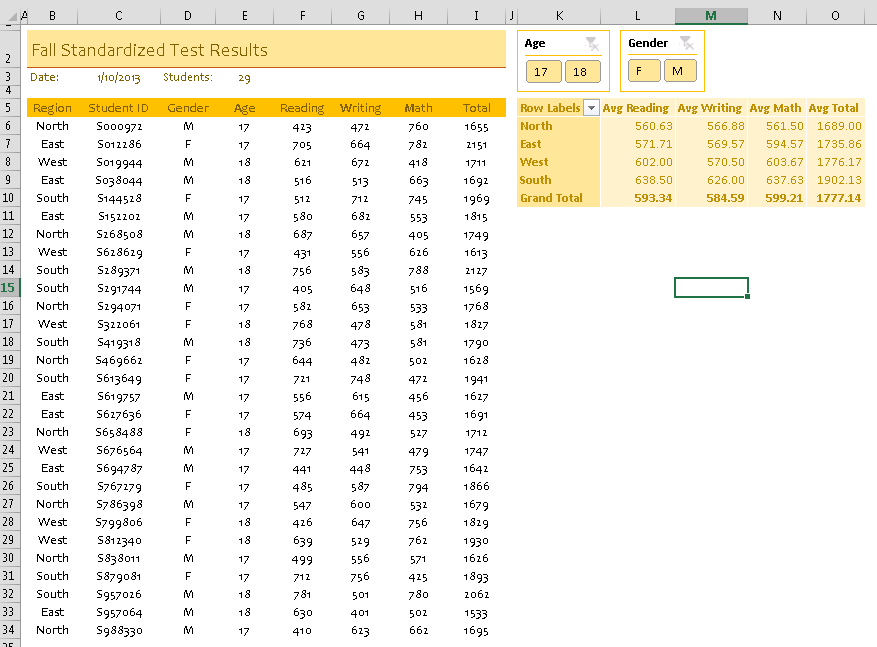
Whenever I need to write a PivotTable macro, I always start by recording myself performing the action I want and then generalize the code later. In this case, I want to select only “M” and “17” in my slicers for 17-year-old male students.
My first pass gives me some useful information:
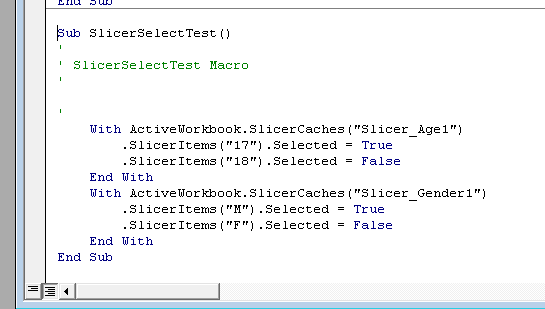
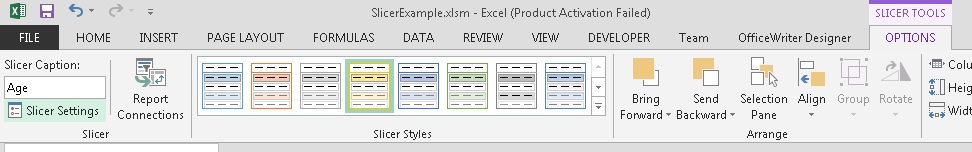
The first thing I notice is the slicer name “Slicer_Age1” and “Slicer_Gender1”. This is the name for the slicer for formulas and VBA. To find the name of your slicer, select the slicer and go to slicer settings. This is on the left, under slicer tools:
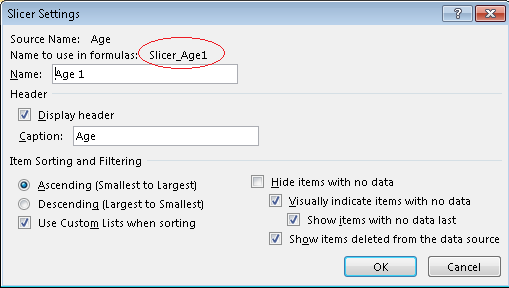
The slicer tool dialog lists the name of the slicer, but also the Name to use in formulas. This is the programmatic name for the slicer that we’ll use in the macro.
Then I was able to generalize the macro to take a slicer name, value, and whether it should be selected or deselected:
'Selects or deselects a value (slicerVal) in a slicer (slicerName)

Sub SelectSlicerValue(ByVal slicerName As String,

ByVal slicerVal As String, ByVal isSelected As Boolean)

ActiveWorkbook.SlicerCaches(slicerName).SlicerItems(slicerVal).Selected = isSelected

End Sub
To make things easier for myself, I created a subroutine that would select 17 and “M,” while deselecting 18 and “F.”
'Selects slicer values to display only data for 17-year-old male students

Sub SelectMale17Profile()

SelectSlicerValue "Slicer_Age1", "17", True

SelectSlicerValue "Slicer_Age1", "18", False

SelectSlicerValue "Slicer_Gender1", "M", True

SelectSlicerValue "Slicer_Gender1", "F", False

End Sub
To make sure that the macro runs when the workbook is opened, I called the subroutine in the Workbook_Open() code.
Private Sub Workbook_Open()

SelectMale17Profile

End Sub
As outlined in our tutorial for how to use PivotTables with ExcelTemplate reports, the PivotTable needs to refresh in order for the imported data to display; the easiest way to do this is to set ‘Refresh on Open’ under PivotTable Data Properties. This poses a problem because macros in Workbook_Open() execute before the the PivotTable refresh and the slicer macros will be unable to find the values to select. This results in a run-time error.
To avoid this problem, I wrote a quick macro that refreshes the PivotTable:
'Refreshes the PivotTable as a replacement for the 'refresh on open' property

Sub PivotTableRefresh(ByVal pivotTableSheet As String, ByVal pivotTableName As String)

ActiveWorkbook.Sheets(pivotTableSheet).PivotTables(pivotTableName).PivotCache.Refresh

End Sub
And added it before the slicer code in Workbook_Open().
Private Sub Workbook_Open()

'Refresh the PivotTable with a macro because it may not refresh first

PivotTableRefresh "Template", "PivotTable1"

'Select the desired slicer values

SelectMale17Profile

End Sub
There you go!
A copy of the template file with the macros, a sample output file, and the code used to populate the template file are available for download here as a zip file.
Getting started:
Learn more about ExcelTemplate or try it out in a free trial of OfficeWriter today.
 OR
OR 
Have you heard? OfficeWriter 8.4 with PivotTable support is here! You’re invited to take a first look at the new PivotTable API within OfficeWriter 8.4 in this interactive webinar.
Our Senior Sales Engineer (and adept demo master), Chad Evans, will walk you through several ways PivotTables can help you wrangle and report on your data. Bring your questions or email them beforehand and we’ll be happy to include them.
When:
Friday, February 22, 2013 at 1 p.m. EST
What we’ll cover:
Spots are limited. Save your seat and register today.

Can’t attend, but still want to learn more? Register anyway! We’ll send the slides and a recording of the webinar after the event.