Every year in March, the NCAA hosts the college Men’s Basketball Tournament. Every year, I go through all of the teams, create my brackets, and see if I can do better than my friends. My one downfall is I always have my favorites: you know, the teams you follow because you went to school there, the team your significant other cheers for, your alma mater’s arch-nemesis, or the team with that really cool mascot. Whatever the reason, the biases end up costing you the first round, sidelining you out of the pool. What we need is a simple way to generate our bracket and remove some of that bias.
Instead of using a totally random outcome, let’s use a few of Excel’s analytical features to increase our chances of putting together a winning bracket. Let’s take Mens NCAA Basketball tournament data since 1985 (courtesy of The Washington Post‘s database), that has the history for specific seeds, teams, coaches and conferences – everything from each school’s tournament results to how No. 7 seeds have fared against No. 10 seeds in the first round. Using this data as a starting point allows us to inject reality into our random numbers. Because really, it is not ever worth considering if a 16 can beat a 1, right?
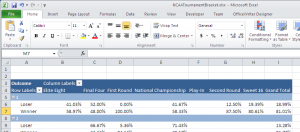
After copying and pasting the data from the webpage into an Excel spreadsheet, it’s time to input the formulas. It’s basically a two-step process. What we need to calculate is the probability of a particular seed winning or losing. If you hadn’t seen it before, a 9 seed beets an 8 seed more often than not, and a 1 seed has never lost. The pivot table I created reflects that, proving to be a useful tool in our selection process. It’s not too difficult to create a pivot table by seed and win/loss and by round for our source data. (See the workbook attached at the end of this post.)
Next, we develop a formula that uses the probabilities along with the RAND() function to predict the outcome of a match-up. All we need to do is apply the random number to the pivot table data to determine which of the two seeds advance to the next round. There is no easy way to do this, except with a long and complicated formula. Luckily, most of the formula is calculated by Excel by doing a simple click. The two Excel functions that get this done for us are the RAND() and the GETPIVOTDATA(). RAND() is well documented, but the GETPIVOTDATA() allows us to treat the pivot data like a database to get our probability for a seed to win the match-up.

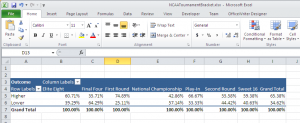
After playing with the output for a few runs, I noticed that the later rounds are fully dominated by the higher seeds. That happens because of the limited data for lower seeds in the later rounds. I want to allow for those Special Case teams to triumph over the Big League teams, so I added a simple pivot table to eliminate the seed as a criteria, and just use higher vs. lower.
The last modification is to store the data in a database, so that we can generate the file automatically. We can add a couple of lines of code to enable OfficeWriter for Excel to take the data from the database and insert it into the file dynamically. Attached is the project to do that, which contains the template file, a script to create the table and insert the data, and a simple webpage to put it all together.
Download the Brackets and Excel Spreadsheets
And there you have it, a completed bracket based off of NCAA historical data, sans favorite team and mascot bias. To see the completed Excel spreadsheet and my 2013 bracket picks, click the links below. Happy bracketing!
The full Excel file: NCAATournamentBracket
The C# project: TournamentBracket
My tournament bracket: TournamentBracket_2013
Note: to save the bracket, you need to turn off the autocalculation feature. This is due to Excel always updating the RAND() output on each change. I recommend changing it to Manual Calculation, and using F9 to run it when you want new values.
Share the post "March Madness: Predict Your NCAA Basketball Brackets with Excel"
 Follow