
Hello everyone, Pitan here! This is the third chapter of my PowerPivot epic. Read the adventure from the beginning with PowerPivot Part 1: Bringing Data Together or continue on to your regularly scheduled programming with slicers!

Okay, so technically slicers aren’t specific to PowerPivot, but they are new to Excel 2010. Chances are if you are working with PowerPivot, you’ll want to know about slicers.
What is a slicer?
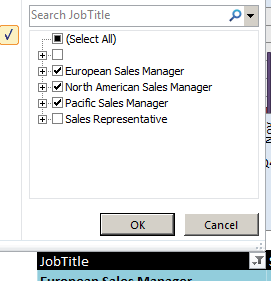
A slicer is a visual representation of a filter applied to your PivotTable or PivotChart. Rather than having to use the drop-downs for report filters, column labels, or column rows like this:
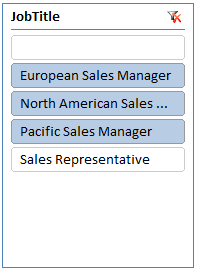
You can have an aesthetically pleasing slicer to show you at a glance what data is filtered:
How do slicers work?
Slicers show all the data that’s available for a field and automatically update PivotTables, PivotCharts and other slicers based on what you’ve selected.
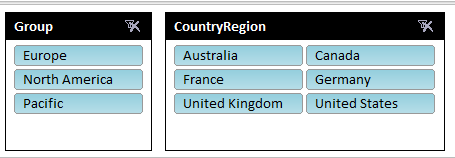
For example, in my AdventureWorks report, all the Country Regions are available:
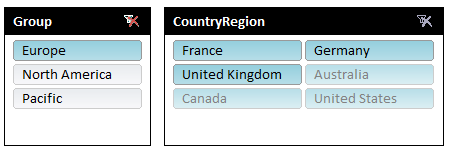
But if I select Europe from the region groups, Australia, Canada and United States are grayed out since there is no Europe data associated with those Country Regions.
You can also hook a slicer up to multiple PivotTables or PivotCharts, so that when the user interacts with the slicer, all related PivotTables or Charts are updated as well.
Both of the PivotCharts in my report are tied to the slicers in my report, but I have a small PivotTable that is not:

This means that when I select values in the slicers, the PivotCharts will be updated, but the PivotTable will not be affected by the selected slicer values.
How do I add a slicer?
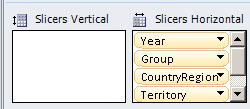
With PowerPivot, just drag the field you want to use as a slicer into the Vertical Slicers or Horizontal Slicers box in the PowerPivotField dialog.
You can use slicers in regular Excel 2010 as well.
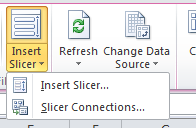
To add a slicer:
- Click on a PivotTable or PivotChart to activate the PivotTable Tools tab in the ribbon.
- Go to the Options tab.
- Click Insert Slicer
Here’s an example of the slicers that I used in my sample PowerPivot report:
![]()
How do I format a slicer?
The easiest way to format a slicer is to apply a slicer style. If you don’t like the way your slicer looks, you can design your own slicer style. I will cover this in my post on how to format slicers.
Some thoughts
Slicers are an awesome way to show the filters applied to a report. They also serve as the building blocks for creating a custom PowerPivot application because users can quickly interact with the report to pull up custom views of data.
This is especially important when working with PivotCharts. It’s much easier (and prettier) for users to interact with slicers than to have them fiddle with filters on a PivotChart. You could also do away with filters on the chart altogether and just have the slicers do the work for you.
The only major annoyance of slicers is that they have a tendency to shift around a page, based on the positions of PivotTables and Charts. Debra Dalgleish‘s Excel tutorial blog, Contextures, has some wonderful ideas for how to counter slippery slicers: Keep Excel Slicers From Sliding.
To be concluded next time with Sharing PowerPivot Workbooks!
 Follow