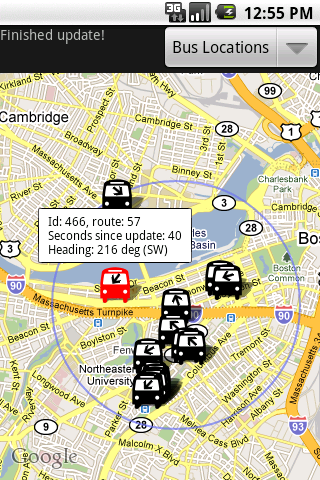
 In working on my spare-time app BostonBusMap, I’ve repeatedly run into problems where I need to cut down on memory usage or running time. It’s not difficult to hit memory limitations on Android, especially on earlier devices which may allow only 16MB per app. Garbage collection can cause noticeable hiccups (especially before Android 2.3), which is one reason why memory usage can impact an app’s sluggishness. Here’s a list of things I did to make my app more responsive:
- First, read the Android performance guidelines. It’s also worth rereading this page from time to time because newer Android versions have more advanced capabilities that may influence the optimizations you make.
- One other important thing that bears repeating from that page is, don’t optimize unless you can show that there’s a bottleneck, because optimizing is a lot of work and can make code less maintainable
- Memory allocations are expensive. Be lazy in allocating objects if they are only used in edge cases
- Use DDMS. This is available within Eclipse and as a standalone tool:
- Profile against smaller amounts of data at first, to make the experience less painful and time consuming for you. Debugging will slow your app down in general
- Click on the green cylindrical icon to the left (called “Update Heap”) to turn on heap tracking for a thread. This will update whenever a garbage collection occurs (you can also force garbage collections)
- Under the “Allocation Tracker” tab on the right, click “Start Tracking” to track allocations. This has several limitations though: only the last 512 allocations are shown, and the stack trace only shows the last 8 method invocations, which can hide some important information (see this message)
Each item has an allocation stack trace - Click on the “Start Method Profiling” button (the one with three arrows and a red dot) to record method invocations. Note: the files that are created seem to run out of room quickly if there are lots of invocations at once. You may also need to create and enable an SD card in your emulator for older devices. When you stop profiling (click the same button, which should have a black dot now), Traceview is started with the method information that was captured.
- You can also use DDMS to turn on debugging at any point (via the green bug icon all the way on the left), which can allow you to skip over irrelevant pieces and only debug at bottlenecks
- One oddly effective technique for me was to run the app in debug mode and hit the pause button in the debug view during a bottleneck. I found two cases where I was needlessly creating objects using this method: see my blog post for more details
- At one point I just had too many objects in memory at once: every route and bus stop was loaded into memory when the app started. (There are roughly 8000 of these, counting twice for routes that share a stop.) To fix this I wrote a pool class which only maintained some number of bus stops in memory at once, removing older stops when necessary and populating newer ones from the database
- Avoid memory leaks:
- First read the android docs on memory leaks
- Don’t put significant amounts of data in static fields
- Clear your Activity’s fields in the onDestroy() method of that Activity. Apps aren’t necessarily killed when you press the back button to exit out of the Activity
- Remember that an Activity is a Context. Anything which hangs onto a Context (like a Drawable, or something which hangs onto something which hangs onto a Context, etc) is also potentially hanging onto an Activity and whatever else it contains
- You can spot memory leaks by enabling heap updates (see DDMS above) and doing a garbage collection after you back out of an app. There should not be a significant amount of memory left over
- Database IO is slow; read/write only when necessary
- See my blog post on the pitfalls of trading floating point accuracy for speed. There’s no speed benefit in 32-bit floats vs 64-bit doubles, only a memory benefit.
- There’s a neat tool called Hierarchy Viewer which allows you to see bottlenecks in your UI code as your app is running. I haven’t made much use of it yet, but it might be helpful for more complicated UIs
Share the post "Developing Android Apps: 10 Performance-Boosting Strategies"
 Follow