[In OfficeWriter 8.6 we introduced support for sparklines in your Excel reports. Sparklines are mini graphs that live within a cell of your Excel spreadsheet to quickly visualize and identify trends in your data. Below is an example of how to use sparklines within OfficeWriter reports.]
Hi! My name is Kyle and I worked on developing support for sparklines in ExcelTemplate. For those unfamiliar, a sparkline is basically a small chart that lives in a single cell. Sparklines are a great way to quickly visualize trends in data, especially if they are located in cells near their data source.
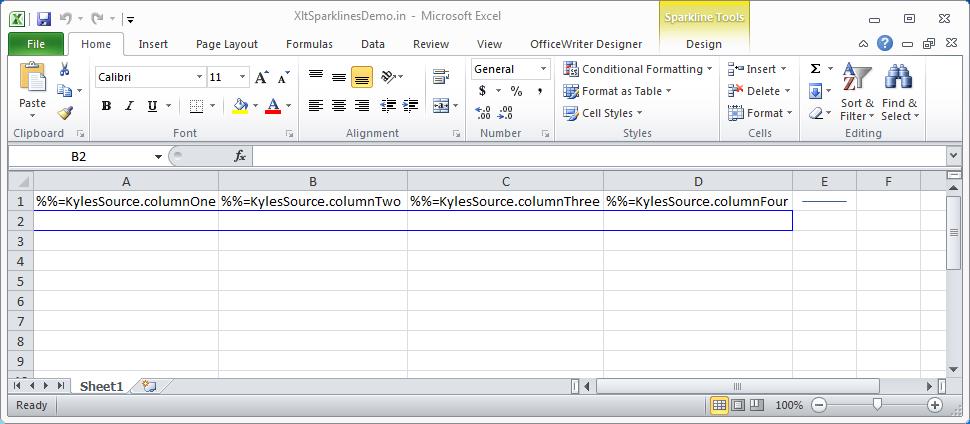
Below we’ve put together a demo of using sparklines within OfficeWriter’s ExcelTemplate. The first step is to insert data markers and sparklines into the file. Here I’ve inserted a sparkline next to the row of data markers and created a group of sparklines immediately below the data markers. The data source for the sparkline in cell E1 is A1:D1. The data source for the sparkline in cell A2 is A1 and so on for the rest of the group.
The demo code is very simple. We create fake data, open the template file, bind the data, and process the template.
using SoftArtisans.OfficeWriter.ExcelWriter;
namespace XLTSparklinesDemo
{
class DemoSparklines
{
static void Main(string[] args)
{
// The path names currently point to the C drive. Change these
// to match the directory in which the Excel files are saved.
const string inputFile =
@”C:\XLTSparklinesDemo\XltSparklinesDemo.in.xlsx”;
const string outputFile =
@”C:\XLTSparklinesDemo\XltSparklinesDemo.out.xlsx”;
object[][] data = CreateData();
string[] dataNames = CreateDataNames();
ExcelTemplate xlt = new ExcelTemplate();
xlt.Open(inputFile);
xlt.BindData(data, dataNames, “KylesSource”, xlt.CreateDataBindingProperties());
xlt.Process();
xlt.Save(outputFile);
}
static object[][] CreateData()
{
object[] testData1 = {1, 2, 3, 4};
object[] testData2 = {4, 3, 2, 1};
object[] testData3 = {1, 3, 3, 1};
object[] testData4 = {3, 1, 1, 3};
object[][] testData = {testData1, testData2, testData3, testData4};
return testData;
}
static string[] CreateDataNames()
{
string[] names = {“columnOne”, “columnTwo”, “columnThree”, “columnFour”};
return names;
}
}
}
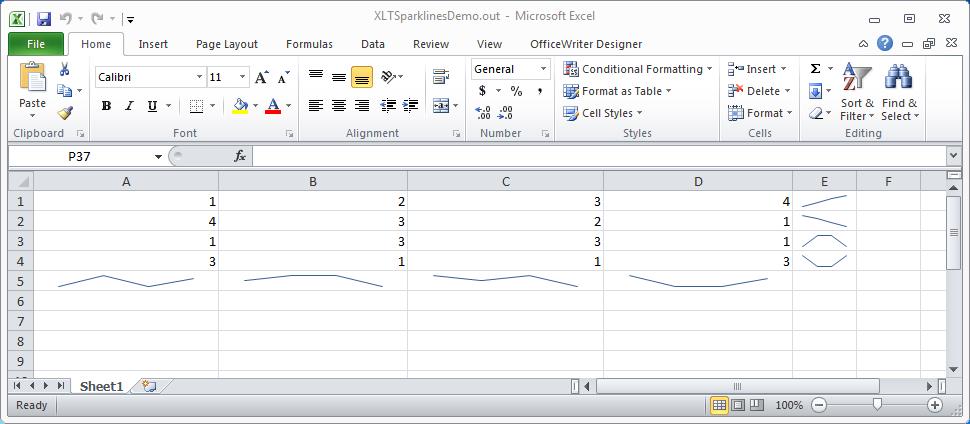
ExcelTemplate will generate a sparkline for each row of data that was inserted. The sparkline group below the data markers is moved down to accommodate the insertions. Additionally, the data range for the sparkline in A5 is now A1:A4 and so on for the rest of the group.
You can download a copy of this demo here. This feature was implemented in OfficeWriter version 8.6, and you’ll need an OfficeWriter license. You can download an evaluation version here if you don’t already have OfficeWriter installed.

 Follow