Starting in version 7.1 of ExcelWriter, you can use grouping and nesting markers to display flat data in a grouped and nested format using the ExcelTemplate object and a OOXML (.xlsx) template. Not a current ExcelWriter user? No problem: you can download a free evaluation and follow along!
Introduction
In my previous post, I showed how José, a salesperson at PostOne Bicycles, was able to easily pick out the sales made by the sales team in different regions by using a %%group marker. His coworker, Jillian, wants to go further than that, breaking down sales first by region, then by Salesperson, so that she can see from a glance whose sales are strong or weak in each region, and whether she needs to improve her performance. That’s easy to do thanks to the nesting feature of ExcelTemplate grouping and nesting.
Nested grouping with multiple groups
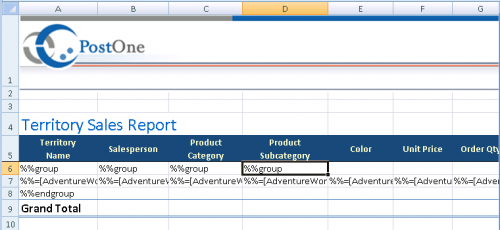
Jillian can group by multiple columns with nesting by placing additional %%group markers in more columns. Additional %%endgroup markers are unnecessary, as the %%endgroup marker marks the end of the grouping block, rather than the end of the group. Each of the new fields will be grouped in order of hierarchy, from left to right unless otherwise specified. In this case, Jillian wants to group first by Territory Name, then by Salesperson, so she places an additional %%group marker in the second column next to her first %%group marker:
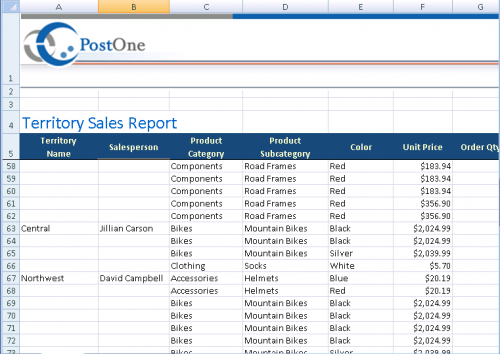
The resulting spreadsheet will be grouped first by Territory Name, then by Salesperson, making it easy for Jillian to see first where each sale was made, then who made it:
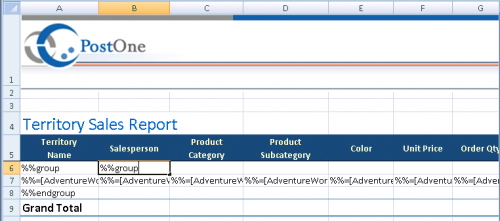
Presented with such a positive result, Jillian decides to more easily view the break down of Product Category and Product Subcategory by adding additional %%group tags:

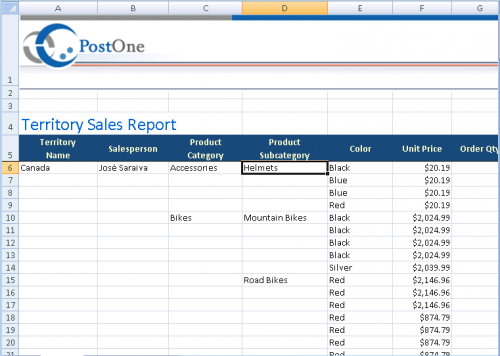
The resulting spreadsheet groups on Product Category and Product Subcategory as well:
Advanced formatting
José and Jillian have already made their jobs a little easier by using grouping and nesting to clarify their performance in their sales reports. But what if they want to improve the appearance of the report further, creating more separation between groups? Even further, what if they’d like to subtotal each of the groups, adding more helpful information to the breakdown? In future posts, I’ll show how they are able to use advanced formatting to solve these problems and create beautiful, full-featured reports.
Further Reading:
For more details on ExcelTemplate nesting grouping, please check out our documentation. Tutorials, from which this blog post is derived, can be found here:
- Using Grouping and Nesting with ExcelTemplate
- Advanced Grouping and Nesting
- Creating Data Markers: Grouping Markers
- Part 1 of the Grouping and Nesting series: Using ExcelTemplate Grouping
- Part 3 of the Grouping and Nesting series: Adding Headers to a Grouped Spreadsheet


 Follow